Entering edit mode

8.9 years ago
epermina
•
0
Hi all,
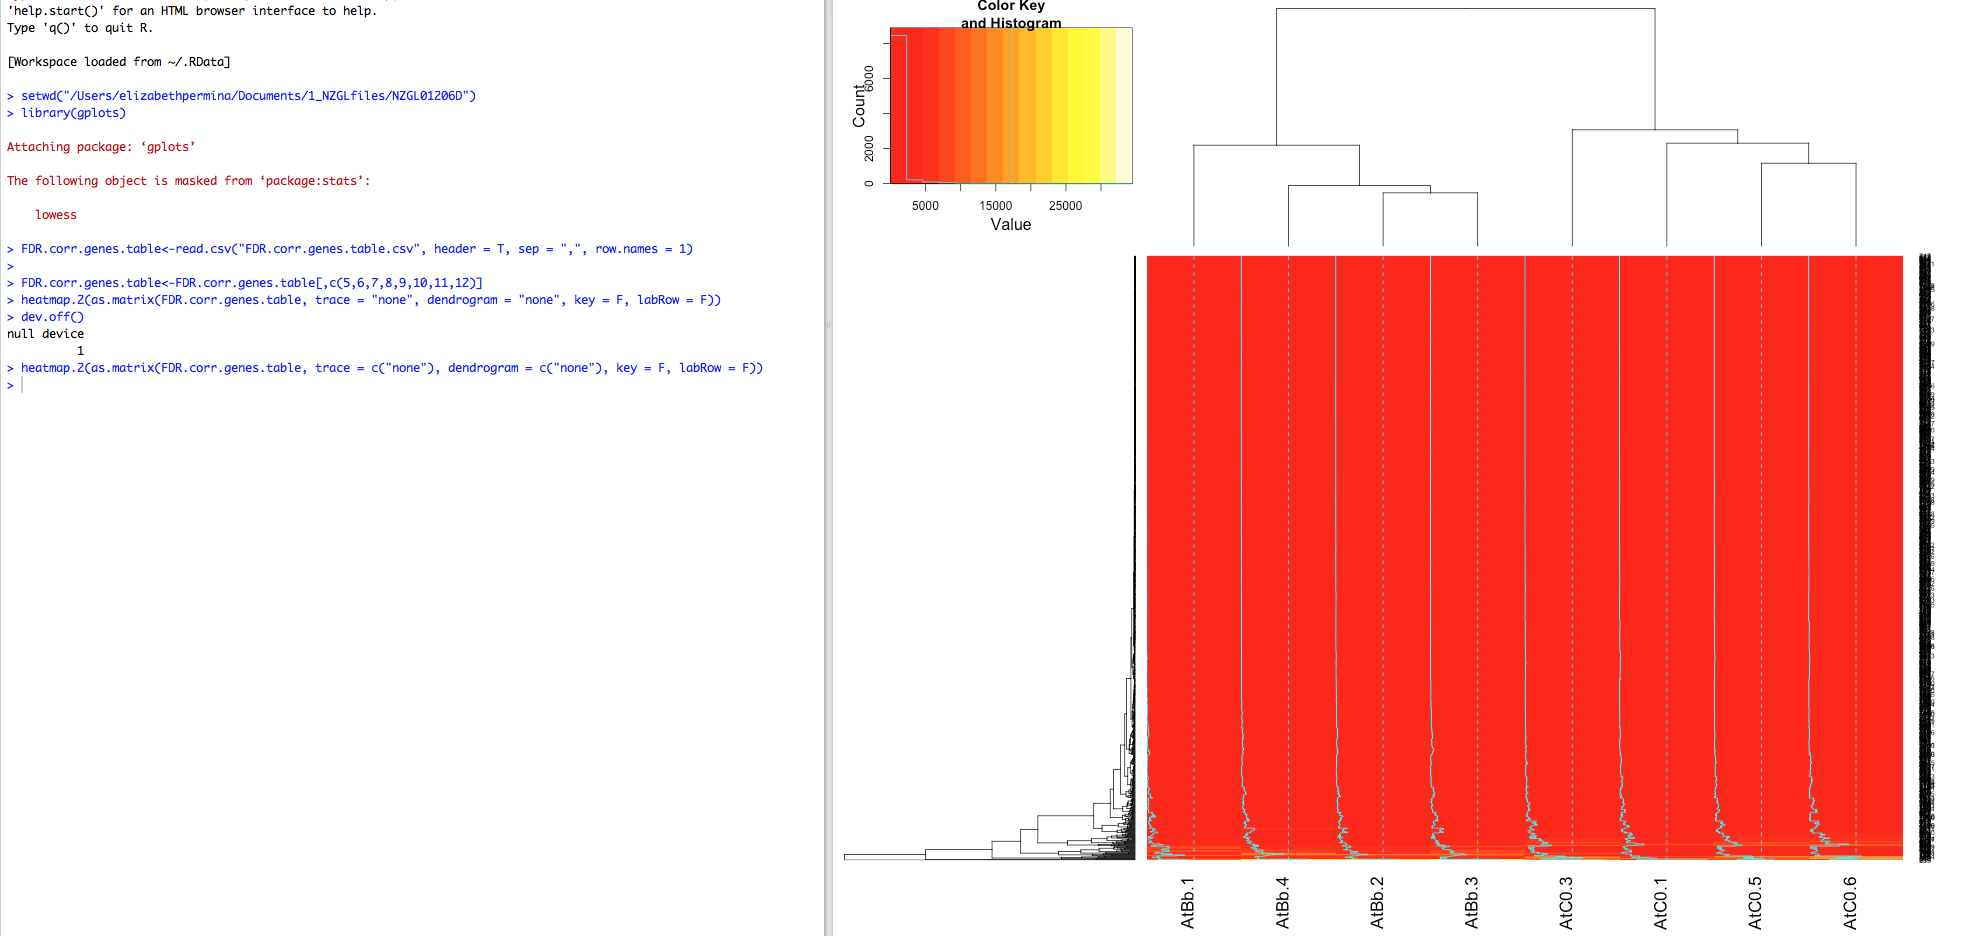
can you point what am I doing wrong here? there bound to be some stupid mistake, but it keeps escaping me. I'm trying to get rid of key, tracing and dendrograms, but they still appear in the image.
The code is the following:
> FDR.corr.genes.table<-read.csv("FDR.corr.genes.table.csv", header = T, sep = ",", row.names = 1)
> library(gplots)
> heatmap.2(as.matrix(FDR.corr.genes.table, key = F, trace = c("none"), dendrogram = c("none"), labRow = F))
I also tried to change trace colour instead of just turning it off, but it stayed cyan, which leads me to believe that I'm doing something wrong in a more major way. I've also tried trace = "none" instead trace = c("none").
Thanks!
