How Do I Set Up Gbrowse For Comparative Coverage?
2
5
Entering edit mode
13.9 years ago

I am using the gbrowse2 samtools setup to display short read data in terms of coverage plots. Gbrowse is selecting different ranges or limits for the plots (as you see below 8, 20, and 50). I want them all to be the same so they can be compared visually.

How do I set this up so that the plots "know about each other"?

alt text

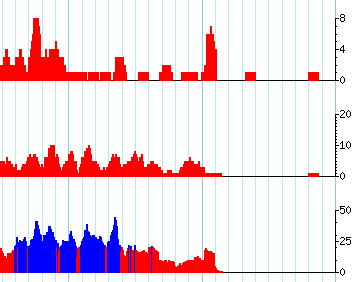
current example of track setup:

[UntreatedReadCoverage]
feature        = coverage
glyph          = wiggle_xyplot
database       = readsUntreated
height         = 50
fgcolor        = black
bicolor_pivot  = 20
pos_color      = blue
neg_color      = red
key            = Untreated read coverage
category       = Coverage
label          = 0 # Labels on wiggle tracks are redundant.
gbrowse • 3.7k views
ADD COMMENT
1
Entering edit mode

perl, v5.8.8 built for x86_64-linux-thread-multi Generic Genome Browser version 2.00

ADD REPLY
0
Entering edit mode

Not that it is necessary to answer your question, but can you provide info about Perl/GBrowse versions used? I am after the first bump into Safe::World / Perl incompatibility during GBRowse install.

ADD REPLY
0
Entering edit mode

Thank you very much. There is a new version of GBrowse released today (2.10), and seems that SAM support is one of the main things the authors are trying to improve. I hope to have it installed in the basic setup tonight.

ADD REPLY
3
Entering edit mode
13.8 years ago
Scott ▴ 30

Hi Jeremy,

I think your only option is to set min_score and max_score to the same value for all three tracks, which may be unappealing visually for the lower scoring track (but I'm not a good judge of aesthetics or scientific value :-) And of course, the best place to ask this question is the GBrowse mailing list

Scott

ADD COMMENT
0
Entering edit mode

ok thx
is this Scott Cain?
mailing lists are so '90s

ADD REPLY
2
Entering edit mode
13.9 years ago
Neilfws 49k

It can be quite difficult to scale plots using GBrowse. I have not used the wiggle_xyplot glyph, but the documentation mentions an "autoscale" option:

autoscale "local" or "global": If one or more of min_score and max_score options are absent, then these values will be calculated automatically. The "autoscale" option controls how the calculation is done. The "local" value will scale values according to the minimum and maximum values present in the window being graphed. "global" will use chromosome-wide statistics for the entire wiggle or dense file to find min and max values.

This suggests that either "autoscale global" or setting values for min_score and max_score may do what you want.

ADD COMMENT

Login before adding your answer.

Traffic: 2174 users visited in the last hour
Help About
FAQ
Access RSS
API
Stats

Use of this site constitutes acceptance of our User Agreement and Privacy Policy.

Powered by the version 2.3.6