
Hi,
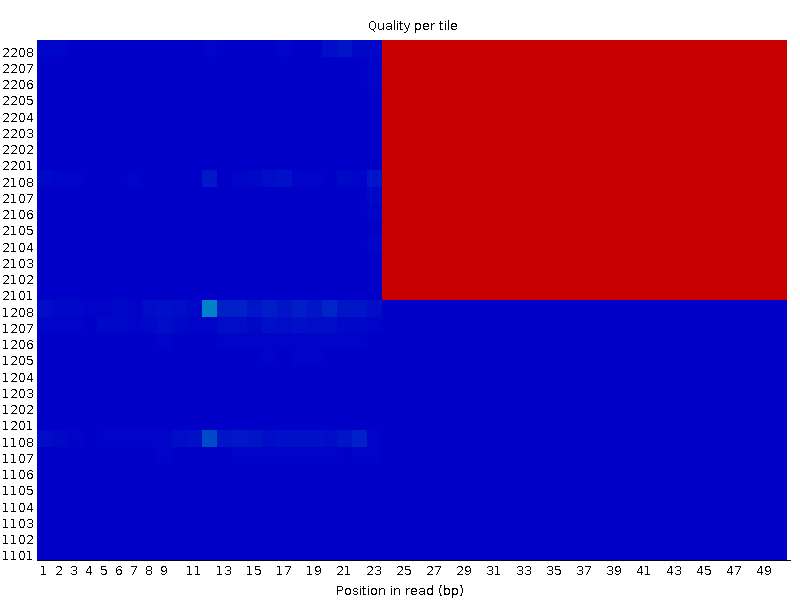
While performing a quick quality control on raw sequence data of one of the datasets I have downloaded online, I observed me a really interesting per tile sequence quality graph. I have already discarded these files from my analysis, but i'm curious on the possible sources of this phenomenon. One of the pair's (XX_1.fastq) result is as following:
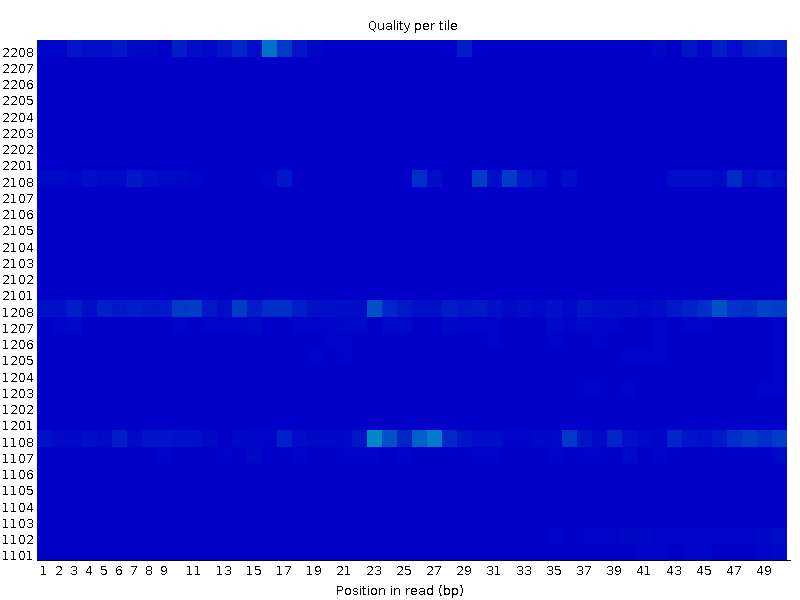
On the other hand, the other file (XX_2.fastq) seems completely OK in the same tiles:
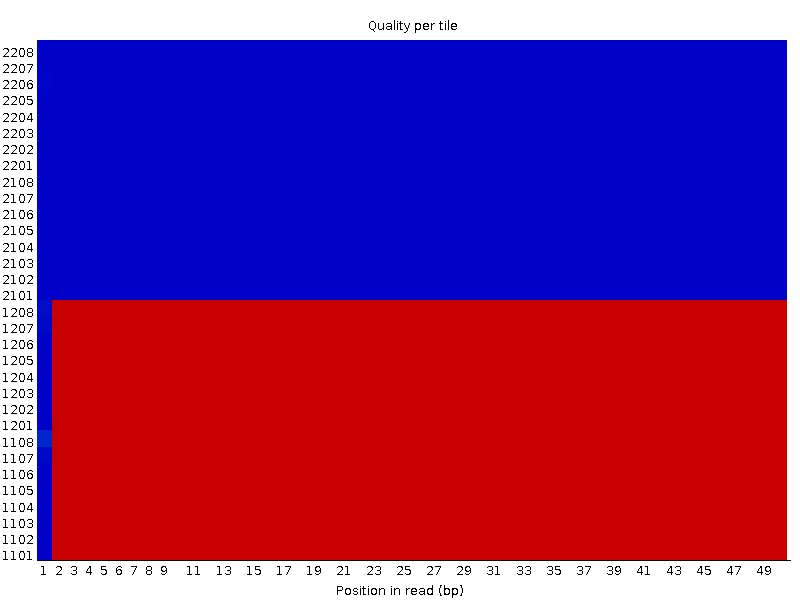
I have one more example with a similar behaviour. The first file:
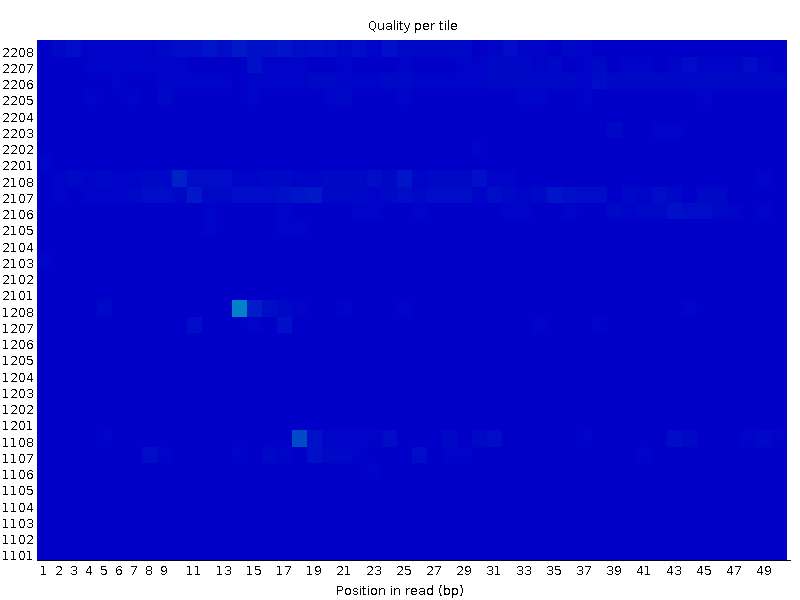
Second file:
I couldn't be able to figure out how this type of graph can co-occur. How come a block of tiles fail in one particular region of the flow cell, while its completely fine for the other end? Is it because of problematic attachment of adapters or more mechanical problem within the flow cell completely?
Thanks!

Thanks for the link!