I'm new in analyzing RNA-Seq data coming from Illumina plateform.
As a first step, I tried to fastqc only one file, and I obtained this result. As you can see, I got failure in 6 modules. I think that the Sequence Duplication Levels module (despite the failure) is ok in RNA-Seq data.
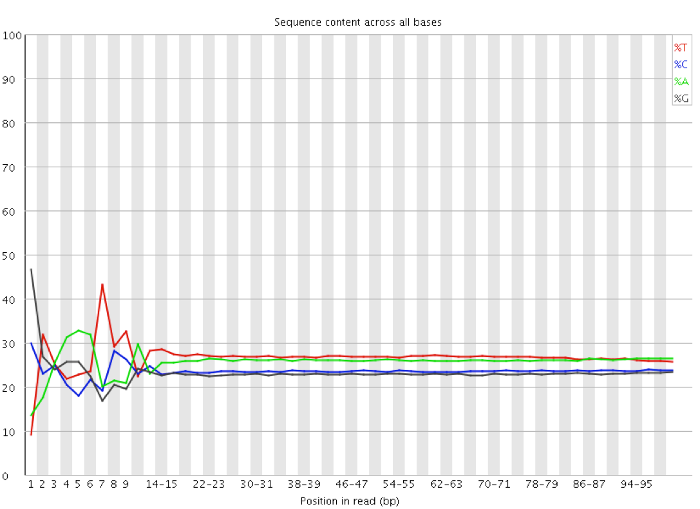
My question is to know if I have to trim the first 13 bp from the reads (Per base sequence content show the failure) or not ?
And I need some advices from you about the kmer content failure.
Your data have very high levels of duplication and in the 10,000+ region. That is quite worrisome. In RNA-Seq duplication levels in the tens and hundreds are ok, 10K+ region is not ok. Your most duplicated sequence:
is present 200K times and appears to match ribosomal DNA.
Hence to me it looks like your data has not been rRNA depleted most of the reads will map to rRNA. You may have to make do with just 7% of the data meaning about 2 million reads from the original 39 million. That may or may not be sufficient.
At this point worrying about quality filtering or kmer content is not all that relevant, that won't really make much difference.
thank you for your suggestions. I have performed the mapping of the 1M first reads to the reference human rRNA including 5S, 5.8S, 12S, 16S, 18S, and 28S, I got a result of 83% of mapping. I don't know what I'll do since the data I'm handling come from a NGS experience performed by another person.
Please do NOT trim the first bases. You may be throwing away perfectly good data. See this blog post from Dr. Simon Andrews for more background on this. @decosterwouter: You may want to see the post as well.
This must be a stranded RNAseq library (which is indicated by the GC predominance).
Having a red "X" appear on FastQC module does not indicate an automatic failure of data. Simon had to decide on some reasonable intervals for judging the output of various modules and this "observation" becomes a side effect of those choices (I think those limits can be changed by a settings file, if I recall). You would want to consider what kind of data you are dealing with before deciding the actual failures part (other posts here are useful as well).
The plot in that blog post and the explanation for it are confusing.
Note how the plot is binned after position 10. The first 9 measures are individual measures but the rest are averages binned by some window, not explained properly. The labels don't seem right either. What the heck is 14-15? Of course the line is smoother after it gets binned. That plot (with many others in FastQC) are unscientific IMO.
The binning can be turned-off on the command line. FastQC will plot individual cycles in that case. Plots get unwieldy for long runs so the default binning is used. Can the plots be done better I am sure they can but they serve the basic qualitative purpose now. FastQC code is open source so perhaps someone here can improve that part.
You should not trim the first 12-13bp of your data, these are of good quality. I have seen a similar pattern in almost each RNA-seq sample. Per base sequence content seems to fail because of a slight bias in the reagents or protocol for a sequence composition in the first bases, such that are reads having a certain composition in the beginning are slightly enriched. Most of the tests FastQC runs are irrelevant for RNA-seq and mostly cause confusion. As you suggest the sequence duplication level is generally higher in RNA-seq. But the duplication level is quite high in your sample. This could be due to few very highly expressed genes, high content of ribosomal RNA, that is something you should check.
I would suggest to use trimmomatic, which will also take care of the reads running into adapters. I would recommend trimming part of the beginning (~12), perform adapter clipping and then perform QC again. Perhaps removing low quality bases at the end will improve your result. The trimmomatic manual is very helpful. Veel succes met de analyse!
http://www.usadellab.org/cms/?page=trimmomatic


This looks like an example case for What is the reason for most software errors in Bioinformatics according to you?