
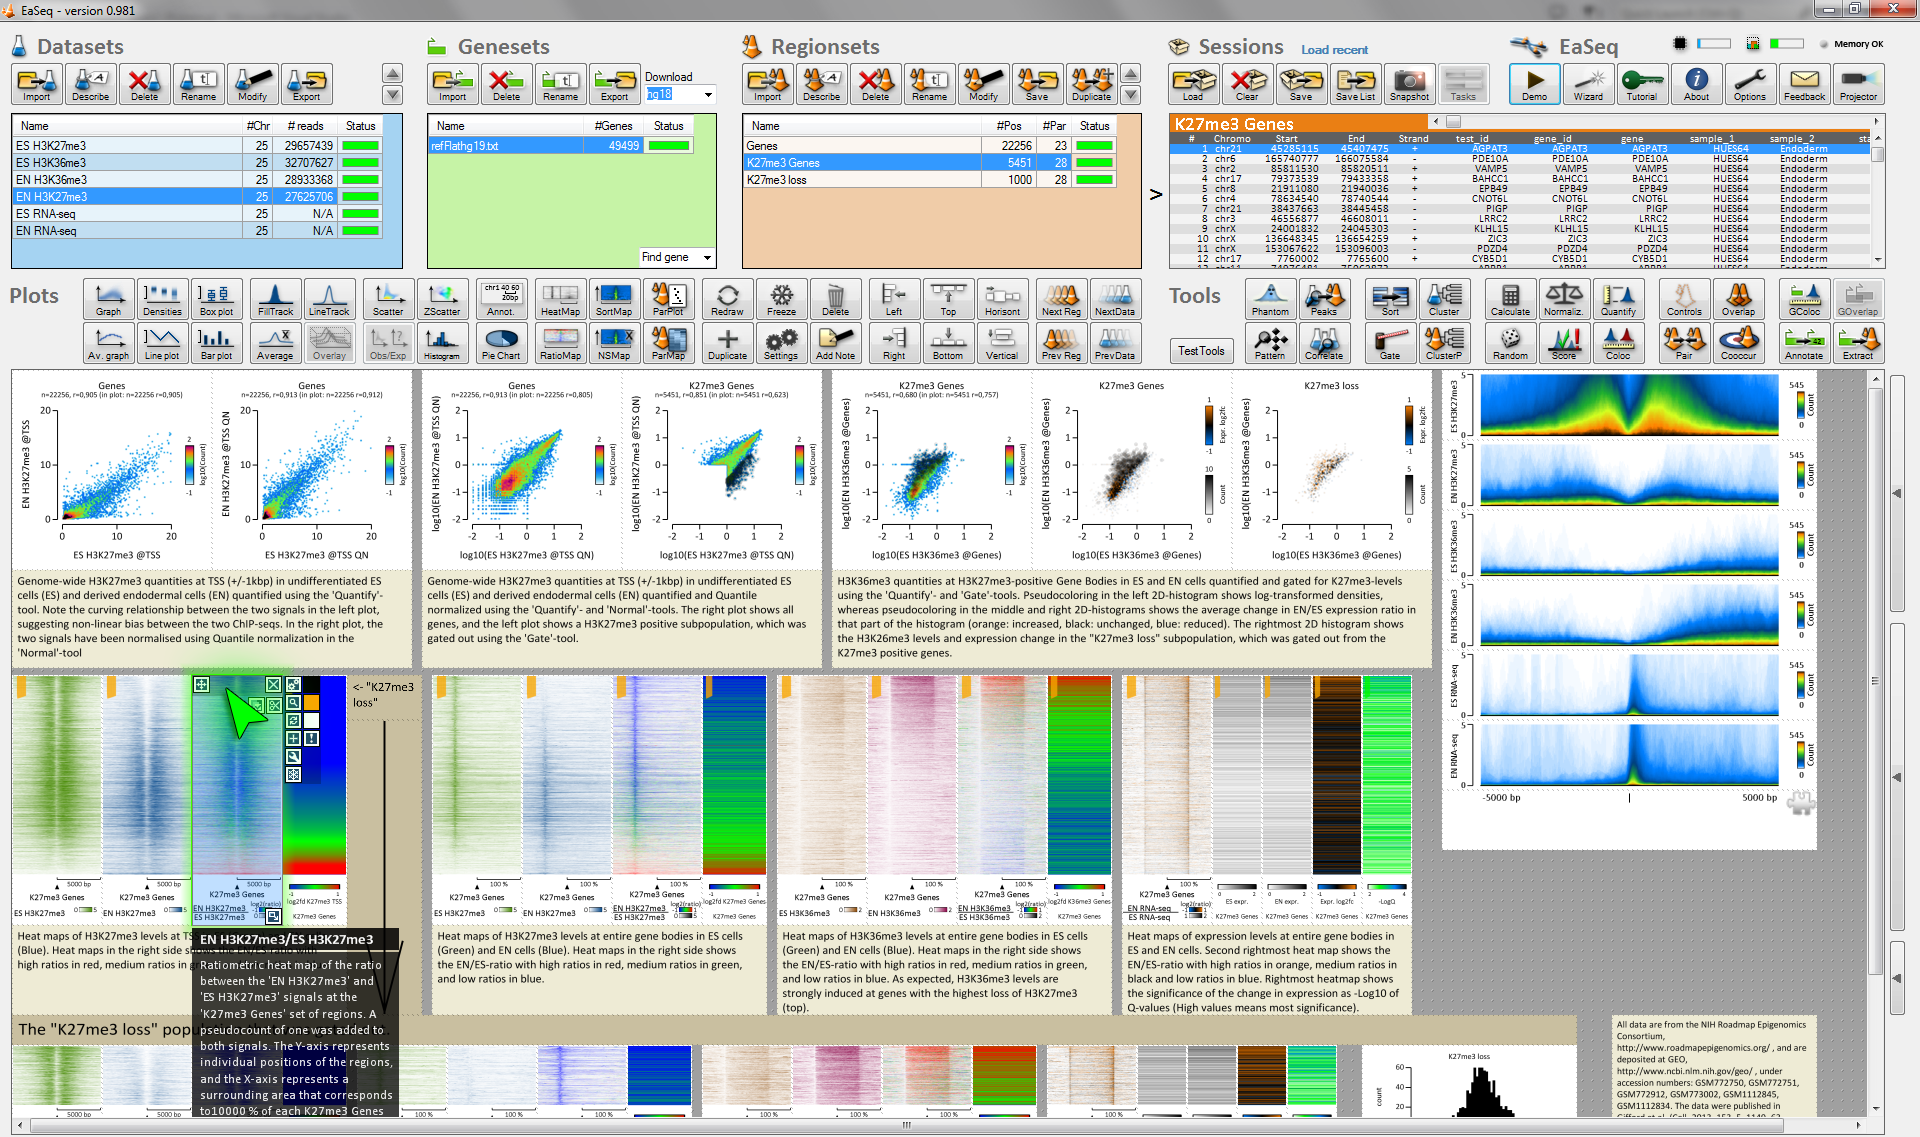
EaSeq enables interactive exploration, visualization and analysis of genome-wide single-read sequencing data (mainly ChIP-seq). It has a point-and-click interface and runs on a Windows 7,8, or 10 PC or virtual machine.
Visualizations can switch between individual genomic loci (as in a genome browser) and thousands of loci at a time as e.g. a plot of average signal, a scatter diagram, or a clustered heatmap. Subsets of loci can be inspected just by selecting them in a plot. >20 analysis tools are integrated, including peak-finding, quantitation, normalization, clustering, distance analysis, randomization, scoring, and normalization.
Plots can be rearranged, duplicated, and instructed to show another population of genomic loci, so an existing visualization of e.g. CpG-islands can nimbly be reused to make a similar visualization of a set of enhancers. EaSeq autogenerates legends and descriptions of the handling and can store plots together with underlying data and these descriptions as a single compact file.
EaSeq is published here http://dx.doi.org/10.1038/nsmb.3180 and can be downloaded at http://easeq.net

I just wanted to give you an update.
I went ahead and added EaSeq to my earlier post. I have to say ... you have outdone yourself. The program is leaps and bounds impressive. Despite the windows only based platform, it has more or less become my main heatmap software. Keep up the good work.
Thank you for the update and for including EaSeq in you comparison. I think that the forum users who are not that comfortable with command lines will appreciate to learn that adequate GUI-based alternatives do exist.
I am also very happy to hear that you appreciate the program - especially in the light of your meticulous comparison of different heatmap tools and the extra layer of handling that the Windows platform provides on a Linux machine.
I am getting help from a guy at my institute to assess how feasible a Linux migration is (fingers crossed). We plan on doing that during the summer - I’ll keep you posted.
Additional tools and features for EaSeq are under development, but if you have suggestions on how to make life in EaSeq easier or analyses better, then I always appreciate input.
My boss (who knows nothing about bioinformatics but a lot about the data) really likes this, based on the vimeo video: https://vimeo.com/123718845
Too bad its only for windows, but hopefully others will work in the interactive space more now too.
I am glad that it at least appeals to one of you :-) I would really have loved to make it crossplatform from the start, but perfect shouldn't be the enemy of good...
Future movies will be on youtube instead: https://www.youtube.com/channel/UCnZM65AeCnOCu6Lt6g8CVpw (also linked here: http://easeq.net/demo/)
This tools looks amazing. I don't have access to a Windows system but will give it a go at home. Kudos for making it. Developing good looking GUI based systems takes special skills.
Thanks a lot - then lets hope that I had those skills when making EaSeq :-) A GUI does not eliminate the learning curve, so I'd appreciate any feedback on how to make the program more accessible.
This tool was talked about quite a bit in one of my posts. However because of the windows only platform, I haven't been bothered to boot it up and add it to the list. I'll have to go ahead and find some time this week or next.
Yes. I noticed that, but I also thought that it would be inappropriate to interfere with your assessment. I am hardly unbiased, but I'll gladly assist when it comes to run and use EaSeq.
Thank you for generating this software. I am a beginner of these bioinformatics, so these kinds of software are quite helpful.
But I have a problem because I can not import my Bed files which are made with MACS. I got the following error message; "Index was outside the bounds of the array". I would appreciate it if someone can show me how I can sort it out. Thanks,
Thanks for the file. As I mailed you, then the peaks are imported without any problems on my machine. However, only if I import them as Regionsets, which in EaSeq as the genomic locations that you would like to investigate / visualize.
EaSeq requires you to import e.g. peaks, enhancers, or CpG-islands as Regionsets, and if I try to import the peak-set as a Dataset, then I get a similar error. Only files containing mapped reads from ChIP-seq or similar should be imported as Datasets.
You are not the only user, who have not been aware of this, so I have not communicated this distinction well enough.
I have therefore changed the program to automatically identify and warn about situations where a user tries to import a Regionset as a Dataset and vice versa. The current release (v 1.02) includes this addition. I hope it helps, but let me know, if you find things that I can make better.
I am working on a detailed description of data requirements and distinctions for the website. I'll link it here when finished.
As promised, I made some pages explaining the distinction, data requirements, and import further. The entry page is here. No images yet - Working on that. Please let me know if any of you (also more experienced bioinformaticians) think that there are things that needs to be clarified or changed.
Hi there! Awesome program! I just started using it with VMWare on my Mac.
I'm having a similar difficulty with this issue of Dataset vs. Regionset as well.
I have MACS2-called ChIP-seq peaks (ChIPed a transcription factor) that have been called and then normalized to Vehicle control samples using BedTools in Galaxy. Because of this final normalization step, my files are bedfiles, not bam. Now I'd like to visualize these genome-wide peaks using Easeq. But when I tried to import them as datasets, I got a warning message that I should instead import as a regionset. I'm pretty sure I'd want to look at these peaks as a dataset. When I tried to import them as a dataset anyway, I got the "index was outside the bounds of the array" error as well.
I read through your data pages on your EaSeq website, so I think my ChIP-seq data should be imported as a dataset. Am I just not understanding something fundamental about my dataset? Thanks so much for your help!
Did I understand your question correctly? The peaks are stored as a bed file, and you try to import this file and nothing else. In that case the peaks should be imported as a regionset. They are no longer considered as the chipseq data, but as a derived set of regions. To make figures you will also need to import your tf reads (the data used for peakcalling), vehicle control or other chipseq reads, e.g. Histone marks. I hope this helps. If not then please post back.
Adding to this:
I seem to have a problem importing bedGraph files. I typically always get a 'index was out of bounds' error of some sort. BAM files work great, but takes too long when importing multiple datasets at a time.
Odd. Can you please send me a link to one of the files that gives you troubles. Then I’ll debug the import.
If you don't already do it, then I would recommend that you save a session containing your imported data after import. That will save you quite some time.
Importing the reads from bed files is also faster than bam files.
Two notes: I am out of Office, so I wont be able to look at it before wednesday. Visualization of coverage files (bedgraph and wig) is slower than read files (e.g. bed and bam).
Bed files from MACS are usually imported without problems. Could you please mail one of the files that cause troubles to mads.lerdrup@bric.ku.dk ? Then I'll find out why you get this error and how to avoid it.
Wish it can be used on mac :)
So do I. Rest assured that I'll shout out it loud, if I make a succesful porting to mac and linux :-)
A short update. It is not off the table, but so far the porting is unsuccessful and will require more time that I initially hoped for.
I have discovered that cloud-based Virtual Desktops are becoming very common and affordable. So essentially you don’t need to install Windows, but can run it from the cloud.
I found seven service providers offering this (links below) – it might make sense to find the one with the most proximal data center to limit latency. One of them even focus on providing this for gamers, so I figured that refresh rate and latencies must be manageable.
Links are here in random order 1, 2, 3, 4, 5, 6, 7 (Not sure if I violate forum-rules - if I am, then have my sincere apologies). Please let me know if you accumulate any experiences using this.
thanks! I am still waiting for the mac version...