Hello All,
I am using geneSCF on a set Differentially Expressed genes with KEGG database, and it's giving me more significantly enriched pathways than DAVID tool on the same set of genes.
Also, I noticed its showing more genes as Enriched for each pathway in addition to the input set of DE genes. I am using Gene symbols as input set.
Would be great if someone has a suggestion about this.
Thank you


Do you get genes which are not present in the input list shows up in your enriched terms? What was your input Entrez IDs or Gene Symbols !!!
Yes, I saw 2 additional genes for a specific pathway. And my input is Gene Symbols
First of all I want to clarify that GeneSCF converts from Gene symbol to entrez IDs for matching source database (especially for KEGG) in more efficient way. Single gene symbol can match multiple entrez id, in that case you will end up in getting one or two extra genes.
Also explained in these posts,
http://bioinfoblog.it/tag/gene-conversion/
"When you convert symbols to id, it is important to remember that not only the same gene can have more than one symbol, but also the same symbol can match multiple entrez ids."
Why does biomart return multiple Entrez IDs
Ok, I got it. Could you please see the first part of the question.
When I do a functional pathway analysis with GeneSCF it shows up 33 Significant pathways (P_val<=0.05) , whereas with DAVID on KEGG it showed only 1 pathway. It's the same with STRING
1) In DAVID for p-value, please check whether you have selected options box to Fisher's exact test. Because default DAVID p-value is based on EASE, modified Fisher's test (https://david.ncifcrf.gov/helps/functional_annotation.html#fisher).
2) Also check the number of background genes used by DAVID and the number you gave for GeneSCF as background.
The above two factors can influence your results drastically.
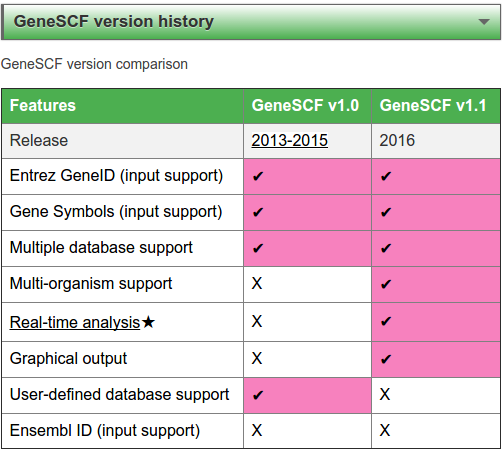
3) Please also make sure that DAVID has the recent release of updated KEGG pathway list (Since GeneSCF uses current release),
http://biorxiv.org/content/biorxiv/early/2016/04/19/049288.full.pdf (page 3)
DAVID release note: It was not clear on KEGG update
https://david-d.ncifcrf.gov/content.jsp?file=release.html
https://david.ncifcrf.gov/content.jsp?file=update.html
KEGG release note:
http://www.kegg.jp/kegg/docs/relnote.html
Ok got ..Thank you so much, I will check those points
Also I have a question, what if I have to view the pathways in Cytoscope it's also resulting with no pathway
Which plugin are you using in Cytoscape?
ClueGo is the plugin I am using. I am not sure what can be the reference set in this case I have to give.Because with the deafult setting on KEGG pathway analysis its not showing any pathways.
http://www.ici.upmc.fr/cluego/ClueGODocumentation.pdf (Page 17)
"The PValue is calculated with Fisher Exact Test. Several methods for PValue correction are proposed: Bonferroni, Bonferoni step-down and Benjamini-Hochberg. We consider as reference the total number of the genes associated with all the terms included in the ontology source used."
Form the above statement I can conclude that ClueGO uses total number of genes associated with all terms/pathways form the source database. For KEGG pathways (up to Release 78.1) there are ~6980 genes associated with 301 pathways (Human). You might be using bigger numbers for GeneSCF background genes, that's the reason GeneSCF picks up more pathways as enriched than ClueGO.
(Tip: You can try reducing background number of genes in GeneSCF close to above mentioned number for KEGG, this might give you some idea.)
If you would like to visualize only the pathways that are enriched by GeneSCF on Cytoscape, play with the filters on ClueGO,
1) Use only the genes associated with the enriched terms on Cytoscape (predefined)
2) Use predefined custom pathways
3) Do not use any filters on Cytoscape
4) Use the network feature.
Soon there will be integration of this network visualization feature on GeneSCF (probably have to wait for long. Still the tool will be command line !!!).
Thank you so much for detailed description. We are aiming to plot those pathways which are the resulted from GeneSCF using ClueGO. So by giving those genes which are enriched in pathways in separate files would do this isn't ? And also I have used the default number of genes as background in GeneSCF (30,000) and in Kegg pathways its way less that than that.Please let me know why is it so.