Dear all,
When I re-analyzed several data sets, I got 0 significant genes regarding the adjusted p-value (Benjamini-Hochberg correction). The adjusted p-values of these data sets are close to 1, but the original papers stated they found significant results.
There are more than one cases but I hereby provide one example with GSE23518 using GEO2R:
GEO2R options: Late stage vs early stage cancer. Benjamini & Hochberg correction. Log transformation. Typical gene expression analysis as implemented in limma package.
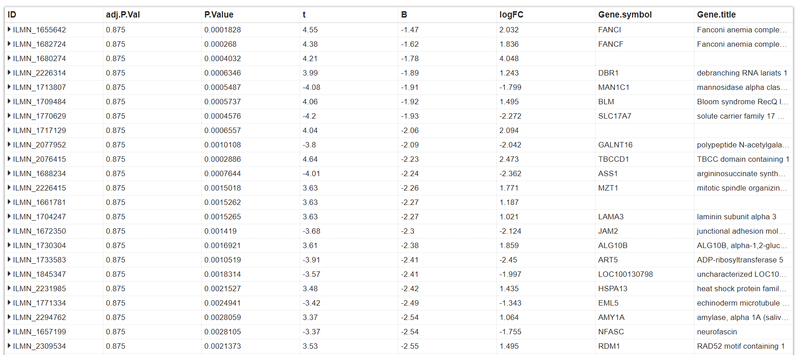
The results:

As you can see, the adj.P.Vals are much more than the acceptance criterion.
When I download the data set using GEO2R package, perform RSN normalization with lumi package:
library(lumi)
example.lumi <- lumiR('fileName.txt')
lumi.N.Q <- lumiExpresso(eset$fileName_series_matrix.txt.gz, normalize.param = list(method='rsn')) # background correction, variance stabilizing transform method, and normalization.
lumi.N.Q
# quality control after normalization
summary(lumi.N.Q, 'QC')
# output the data as txt file
write.exprs(lumi.N.Q, file = 'processedExampledata.txt')
and analyze the results using either limma package, I got the similar result: 0 differentially expressed gene.
If possible, please let me know where did I get lost. Thank you.


You got lost at asking your question, because there is no way for us to know what you did or what the authors you are following did. Please read How To Ask Good Questions On Technical And Scientific Forums.
Thanks, I improved it.
Are you following the published analysis protocol (as closely as you can)? Sometime publications may lack sufficient detail to be able to do this but in general you should at least have some idea of what has been done.
My protocol is quite similar to the authors. However, they stated that they used P-value < 0.01 as the significant level, not adjusted P-value.
I just checked the paper. They are wrong in using unadjusted-Pvalue. If you use raw-Pvalues, you will also get DEGs. Moreover, note that their comparison is always within (and not between) USC and EAC groups.
Thank you for your nice feed back. It is quite strange that we can't get any DEGs when using adjusted P-value, right?
When searching for similar cases (early vs late, progressive vs non-progressive, etc.), I also faced the same situation. I wonder is it a biological or a statistical problem?
I would not trust their data and analysis for the reasons that 1) they are using unadjusted Pvals 2) Even with unadjusted Pval, the numbers of DEGs are very small which is unusual. With this small number of DEGs, I am pretty sure that had they adjusted their Pval, they would have got nothing 3) Their method is not reproducible and robust.
Yes, I agree with your opinion. When searching around, we can also see similar cases, GSE26511, for example.