circos plot gene expression by RNA-Seq
2
3
Entering edit mode
6.6 years ago
kanwarjag ★ 1.2k

Is it possible to show differential expression of genes using RNA seq by circos plot? Are there any specific guidelines or instructions to follow , I could not find anything specific for expression on Circos web page for expression. Thanks

RNA-Seq circos plot • 5.2k views
ADD COMMENT
0
Entering edit mode

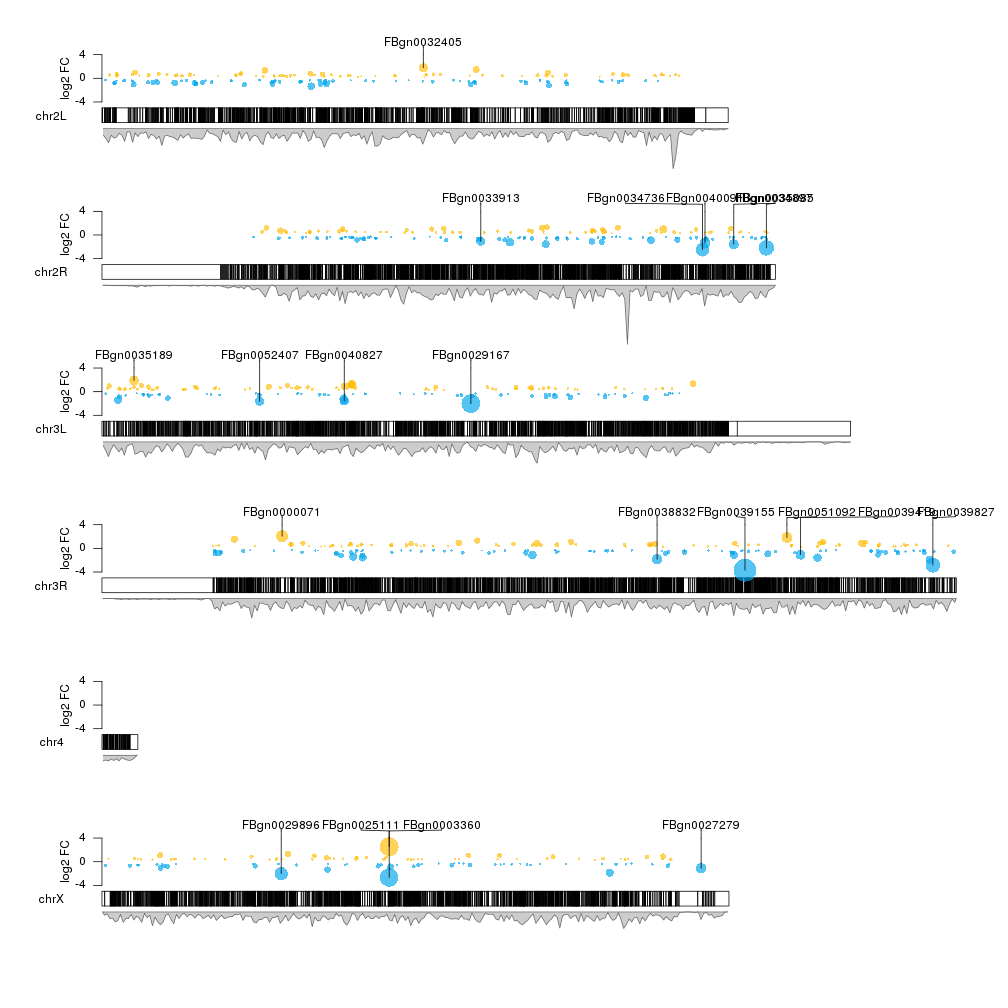
There probably won't be anything specific to differential expression as circos is more of a framework than anything else. I'd suggest you think about it more towards what would be informative on the plot, such as log fold change for example. Apply log fold change as a scatter plot, then you can follow one of the many templates available for scatter plots.

ADD REPLY
0
Entering edit mode

Bar plots for DEGs. No SOP for RNASeq DEG circos plots. Circos is highly configurable

ADD REPLY
5
Entering edit mode
6.6 years ago
bernatgel ★ 3.4k

If you don't mind it not being round, you could use the R/Bioconductor package called karyoploteR to represent differential expression data. At the tutorial and examples page there's an example using the data from the DESeq2 vignette and it has the whole code to go from DESeq2 results to a genome-wide plot of the differentially epressed genes using only R. The example uses Drosophila data, but it can be adapted to any other organism.

The plot looks like this, with the y-axis representing the fold change between conditions and the size of the bubble proportional to the p-value.

Genome-wide plot of differential expression results from DESeq2 using karyoploteR

Hope this helps :)

ADD COMMENT
0
Entering edit mode
6.6 years ago

The instruction will completely depend upon how you are planning to visualize the data. One way to visualize RNA-Seq data using circos is to mark the genes in chromosomes and add another circle repressing up regulation and download regulation using bars of different colors.

Example : https://www.researchgate.net/publication/259606369_RNA-sequencing_of_the_brain_transcriptome_implicates_dysregulation_of_neuroplasticity_circadian_rhythms_and_GTPase_binding_in_bipolar_disorder/figures?lo=1

Relevant discussion: https://groups.google.com/forum/#!topic/circos-data-visualization/PwOsxNL4iog

ADD COMMENT

Login before adding your answer.

Traffic: 2381 users visited in the last hour
Help About
FAQ
Access RSS
API
Stats

Use of this site constitutes acceptance of our User Agreement and Privacy Policy.

Powered by the version 2.3.6