What Tools/Libraries Do You Use To Visualize Genomic Feature Data?
33
120
Entering edit mode
14.1 years ago
brentp 24k

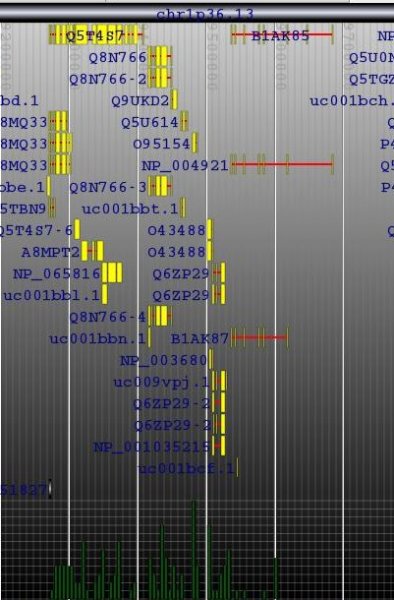
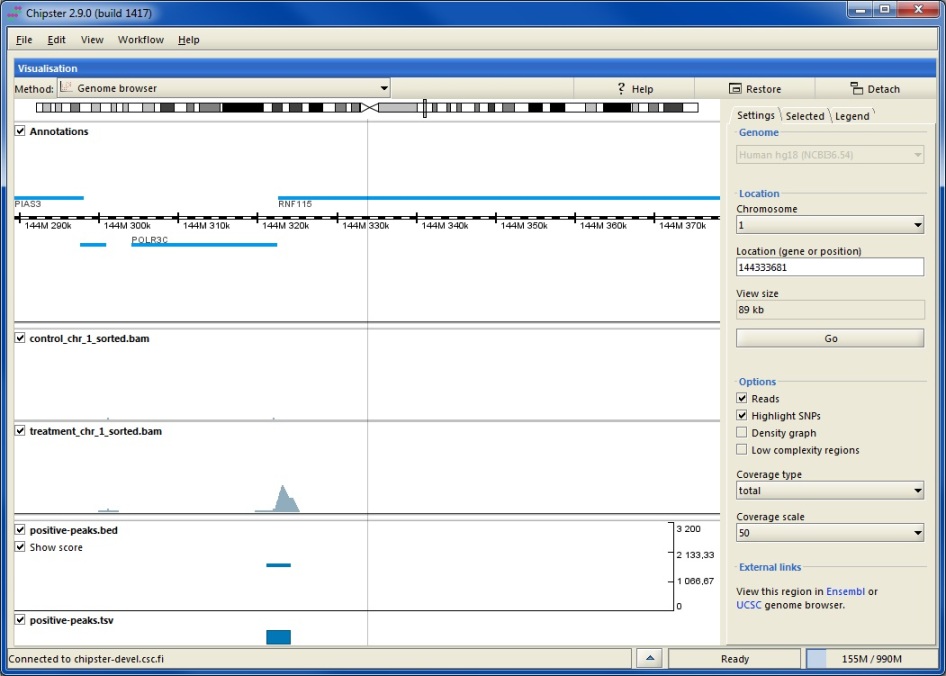
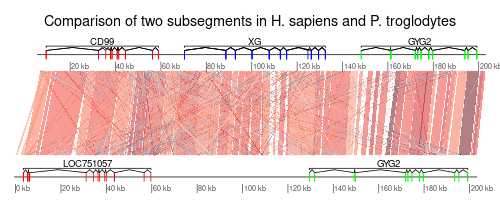
Given some genomic data in a well-known format (e.g. GFF) with gene models, what tool(s) do you use to visualize that data.

What tools allow you to add your own tracks of data easily?

I'm interested in both desktop and web-based tools--with preference to those that are customizable via some kind of API.

genome visualization • 64k views
ADD COMMENT
34
Entering edit mode
14.1 years ago
Cassj ★ 1.3k

I like the Broad's IGV: http://www.broadinstitute.org/igv/ for genome browsing. It handles lots of common data formats, including SAM/BAM files if you're dealing with NGS-scale datasets. Apparently you can talk to it it via http, but you can't say anything very complicated: http://www.broadinstitute.org/igv/PortCommands

ADD COMMENT
0
Entering edit mode

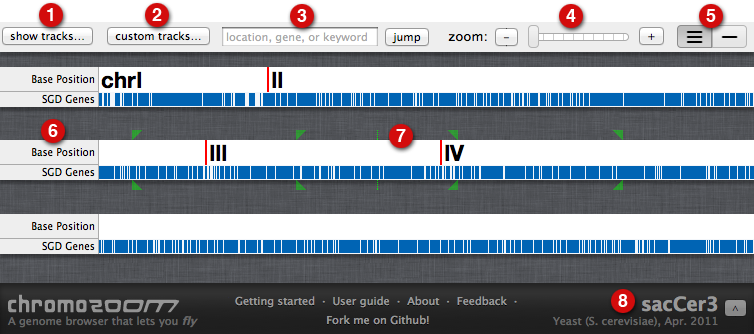
Thanks, I finally had a chance to look at this and while you can't say much, you can say enough to load some data, then (programmatically) go to a bunch of locations and save an image. very useful.

ADD REPLY
19
Entering edit mode
14.1 years ago
Allpowerde ★ 1.3k

A bit different from the linear browsers listed above is the genome visualization tool circos. It can plot a wide range of different data types onto the radially displayed chromosomes. Everything can be customized and is quite easy to use.

alt text

ADD COMMENT
0
Entering edit mode

Wonderful. I haven't gone into details. But the images are really appealing.

ADD REPLY
0
Entering edit mode

Does anyone know of a circos implementation in javascript? Could b in processingjs, infovis, protovis or whatever or straight html5 canvas.

ADD REPLY
17
Entering edit mode
14.0 years ago
Andrew Su 4.9k

Late to the party here, but jbrowse has a nice ajaxy interface...

ADD COMMENT
1
Entering edit mode

Jbrowse is not just a pretty face - the feature encoding is JSON NClist which should scale well. Shame they are using the bioperl GFF3 parser really.

ADD REPLY
1
Entering edit mode

Casbon, what parser would you use instead?

ADD REPLY
0
Entering edit mode

something that doesnt use so much memory ;)

ADD REPLY
1
Entering edit mode

JBrowse's way of getting data into the browser is...special. Our group started with JBrowse to write a platform for our users here, and ended up rewriting large hunks of it, and basically throwing out its backend and replacing it.

ADD REPLY
16
Entering edit mode
14.1 years ago
Neilfws 49k

It's interesting to see votes for the IGV; I've looked at it only recently and it does look very promising as a desktop viewer.

I'm a long-time user of the Generic Genome Browser, a Bioperl-based web application. It is extremely customizable and can act as both DAS server and client. Be prepared to spend quite a bit of time "munging" your GFF files into shape and working on the config file to get the desired results.

I also like Bioperl's Bio::Graphics as a way to take simple text files (including GFF) and quickly generate very attractive plots. There's a similar, but less extensive Ruby library too.

I've recently tried GenomeGraphs, an R Bioconductor package. It fetches annotations from Ensembl and plots them as tracks. It's a good way to overlay quantitative data onto genomic features: here is a sample plot.

ADD COMMENT
14
Entering edit mode
14.1 years ago

I'm using the well-known UCSC Genome Browser http://genome.ucsc.edu/goldenPath/help/customTrack.html

I also wrote an experimental implementation of Jan Aerts' LocusTree based on BerkeleyDB (see http://plindenbaum.blogspot.com/2009/11/java-implementation-of-jan-aerts.html)

LocusTree

ADD COMMENT
1
Entering edit mode

Just to chip in my first comment on BioStar. I also use Gbrowse for this job. Hugely configurable and very easy to install and add tracks to. I've recently been using Gbrowse2, which is a pretty slick improvement. A comprehensive install guide is available at the GMOD website http://gmod.org/wiki/GBrowse_2.0_HOWTO

ADD REPLY
14
Entering edit mode
13.2 years ago
Dave Clements ▴ 610

There's was a great review paper on genome visualization in Nature Methods last year: Visualizing genomes: techniques and challenges, by CB Nielsen, et al. It's part of a whole supplement on visualizing biological data.

And, for what it's worth, both GBrowse and JBrowse are both highly configurable and built to be installed locally, and have active communities supporting them.

ADD COMMENT
13
Entering edit mode
14.1 years ago
brentp 24k

Thanks for all the replies so far. I just want to add a couple I've found:

Annoj with a nice demo here: http://neomorph.salk.edu/epigenome/epigenome.html

seems to be a pretty nice web-interface and I've been able to get my own annotations drawn. it may be an abandoned project, and I wasn't able to find the javascript source (only the packed/minified version).

also genometools wraps cairo to allow simple drawing of regions: here's the image from their home page:

alt text And they have bindings to a variety of scripting languages.

ADD COMMENT
0
Entering edit mode

Anno-j has a really nice architecture. I used it to setup an Arabidopsis browser for custom experimental data along with their existing tracks: http://arab-annoj.appspot.com/. The downside is that I haven't seen any active development in a while, which is a shame.

ADD REPLY
0
Entering edit mode

I thought I had posted GenomeTools as a response to this question. Maybe it was a similar question. Anyway, I'm a happy "customer"--very pleased with their web interface and local application. I haven't tapped into their APIs yet though...

ADD REPLY
10
Entering edit mode
14.0 years ago
Stew ★ 1.4k

I would vote for IGB (Integrated Genome Browser). It can handle a large number of tracks and large genome scale data sets. It is highly configurable and very fast. You can also talk to it via some ports . I sometimes generate excel files with hyperlinks that make IGB jump to specific locations, which can be really useful. So you can have an excel sheet with a list of genes which you can click in one window and IGB jumps to that gene.

Another great feature is the ability to do data manipulation, such as merging tracks using logic, to get overlapping or unique features. You can also do things like log2 transformations.

ADD COMMENT
10
Entering edit mode
13.5 years ago

Another one I found today: GView: https://www.gview.ca/wiki/GView/WebHome

GView is a java package used to display and navigate bacterial genomes. GView is useful for producing high-quality genome maps for use in publications and websites, or used as a visualization tool in a sequence annotation pipeline. Users can interact with the genome using a powerful pan-and-zoom interface, or GView can write static images of a genome to a file. GView can draw a genome using either circular or linear layouts, with additional layout types planned for future release.

alt text

ADD COMMENT
1
Entering edit mode

thanks, that's useful.

ADD REPLY
9
Entering edit mode
14.1 years ago

For desktop level genome visualization the Integrated Genome Browser is a very nice tool.

ADD COMMENT
8
Entering edit mode
13.2 years ago
Chase Miller ▴ 410

Scribl is based on HTML5 Canvas which allows for some nice interactivity (demo). Though it is a little light on features.

ADD COMMENT
0
Entering edit mode

this doesn't seem to work with firefox

ADD REPLY
0
Entering edit mode

Fixed now for firefox. Although the performance is better in chrome/safari

ADD REPLY
7
Entering edit mode
14.1 years ago

I'll put in a plug for Genboree, which my lab develops. It's essentially a genome browser with personalized databases/wikis, access control, and integration with Galaxy. It can import UCSC tracks and you can add any data that maps to genomic coordinates. It also has a REST API that's fairly new.

Since I do a lot of copy-number work, I also do quite a bit of sanity-check visualization with R, often just using simple tweaks of the plot command, but sometimes pulling in packages to help.

ADD COMMENT
7
Entering edit mode
14.1 years ago
Nicojo ★ 1.1k

I use Artemis and ACT from the Sanger Institute. The former is a genome viewer and annotation tool. The latter is used for comparing genomes.

However, I'm not sure that there's an API for it...

ADD COMMENT
6
Entering edit mode
14.0 years ago
Paulo Nuin ★ 3.7k

Circos would get my vote too.

ADD COMMENT
0
Entering edit mode
ADD REPLY
6
Entering edit mode
13.4 years ago
Rm 8.3k

Broad Institute's Integrative Genomics Viewer (IGV) will be my first choice, some other tools also to look at..

ADD COMMENT
5
Entering edit mode
13.2 years ago
Ann Loraine ▴ 50

For visualization of genome re-arrangements, take a look at Gremlin. The authors compared it to Circos and found that Gremlin led to more and deeper insights for users than Circos.

ADD COMMENT
0
Entering edit mode

Unfortunately it seems that this software is not yet available for download according to Ben Raphael's lab software page: http://compbio.cs.brown.edu/software.html

ADD REPLY
5
Entering edit mode
13.1 years ago
Casbon ★ 3.3k

Dalliance is looking nice: http://www.biodalliance.org/

ADD COMMENT
5
Entering edit mode
13.0 years ago

I am currently using LocusZoom for annotation of our GWAS data. It provides neat way to visualize crowded locus regions.

ADD COMMENT
0
Entering edit mode

thanks, i have something i can send to that right now.

ADD REPLY
4
Entering edit mode
13.5 years ago
Puthier ▴ 250

MagicViewer seems also to be a nice solution.

ADD COMMENT
4
Entering edit mode
13.4 years ago

I like Argo from Broad Institute much more than IGV. It works well for visualizing and manually annotating whole genomes and it's reasonably fast. It can run standalone or as an applet/webstart (it's written in Java and distributed as a single jar file).

ADD COMMENT
4
Entering edit mode
13.2 years ago
Chris Whelan ▴ 570

I'll throw another name into the ring - I've recently been using SeqMonk for some of this type of stuff: http://www.bioinformatics.bbsrc.ac.uk/projects/seqmonk/README.txt. I like its capabilities for doing quantitation over user-defined probes along your genome. There's lots of flexibility there for starting an exploratory enrichment-type analysis of your data.

ADD COMMENT
4
Entering edit mode
13.2 years ago

Wow, there are lots of options to do this! One that hasn't been mentioned is the Ensembl Genome Browser. The positive would be the ability to compare your gene models to Ensembl annotation along the genome. For example, in this view.

Click 'Manage your data' at the left. Either upload a GFF file to Ensembl using the 'Upload data' option at the left of the menu, or use 'Attach URL' to attach your file without uploading it to Ensembl. In both cases, you will be able to view your gene models along the genome, and turn on or off other data tracks.

If you need any help with this option, give it a try or ask our helpdesk to guide you. helpdesk [at] ensembl [dot] org

ADD COMMENT
4
Entering edit mode
12.1 years ago

One more from VizBi 2012: Chipster http://chipster.csc.fi/

alt text

ADD COMMENT
4
Entering edit mode
12.1 years ago
ALchEmiXt ★ 1.9k

Very late to join the party but here is an example of an API only viewer in R;

It is called genoplotR and its production/publication ready graphics can be generated within R. It is highly tunable.

Just a random example below;

alt text

ADD COMMENT
4
Entering edit mode
11.3 years ago

One more (January 2013): ChromoZoom

ChromoZoom: a flexible, fluid, web-based genome browser Bioinformatics (2012) doi: 10.1093/bioinformatics/bts695

enter image description here

ADD COMMENT
3
Entering edit mode
11.5 years ago
Irsan ★ 7.8k

Also see the post about drawing chromosome ideograms

ADD COMMENT
3
Entering edit mode
11.1 years ago

GenomeBrowse from Golden Helix is a desktop client.

ADD COMMENT
3
Entering edit mode
6.9 years ago

Well, since this old thread has been revived I cannot help promoting my own tool.

ASCIIGenome is a genome browser based on command line interface and designed for console terminals.

ADD COMMENT
2
Entering edit mode
12.6 years ago

There is one tool called Artemis which is developed by Sanger institute and one more tools called SeqVista

Hope this will help you.

ADD COMMENT
2
2
Entering edit mode
3.0 years ago
jena ▴ 290

No love for Tablet? I'm quite surprised to not see it mentioned here. Of course, IGV is the classic, and Tablet is a bit simpler than that or other tools listed here, but it's a nice quick tool to visualize BAM alignments with GFF features. I use it often when I don't want to bother with IGV, where some stuff is just too complicated - I use IGV mostly for some advanced stuff.

ADD COMMENT
0
Entering edit mode

in all fairness, Tablet did not exist when this thread was started. It is quite impressive that Tablet is still operational though, I gave it a go right now.

For reasons that I can't quite explain if find the output drawn by Tablet as surprisingly distracting, almost discomforting to look at.

It is "too pretty" - I feel gratuitously so. Too many little features drawn to each base, in its own little shaded little box etc. Yet I cannot easily tell which way the read aligns (forward or reverse) The reads have the wrong widths etc. I find it to impose a cognitive overhead.

Just a quick note on why Tablet might not be used more widely.

ADD REPLY
0
Entering edit mode

Interesting, I did not think about it like that. Tablet has several colour schemes in the 2nd tab (I think) to visualize different features of the alignment, including read orientation etc. These schemes actually let me focus exactly on what I need without any visual noise. Maybe that will help you too.

I also like the left sidebar, where I can quickly search contigs and even get basic info, like length or number of mapped reads, which is very usefull when having lower-quality data for non-model organism.

ADD REPLY
0
Entering edit mode
7.4 years ago
Michael 54k

The BioC package ggbio was definitely missing here.

ADD COMMENT
0
Entering edit mode

yes, I think ggbio was either not out or very alpha when this thread began long ago :)

ADD REPLY
3
Entering edit mode

And if we are updating the answer with new(ish) BioC packages, Gviz should also be mentioned.

ADD REPLY
0
Entering edit mode

{gviz} is extremely powerful. For inspiration, I'd suggest taking a look at these scripts used for visualisation of SuperTranscript expression. They helped me in the beginning. This is the cognate paper.

ADD REPLY
0
Entering edit mode
6.9 years ago
dbarrios ▴ 10

Another option is D3 Genome Browser (d3gb.usal.es). It supports the most popular genomic formats and you can easily add tracks with a single command in R or Python.

It is a multi-platform software for quick and in-browser visualization of genomic data and it is available as an R package, a Python module and a WordPress plugin.

ADD COMMENT

Login before adding your answer.

Traffic: 1992 users visited in the last hour
Help About
FAQ
Access RSS
API
Stats

Use of this site constitutes acceptance of our User Agreement and Privacy Policy.

Powered by the version 2.3.6