
please see my data here:
https://user-images.githubusercontent.com/20710640/34529987-ba9f1414-f07b-11e7-913a-3ea787771a6e.JPG
https://github.com/Jinggg2016/NGS/issues/4
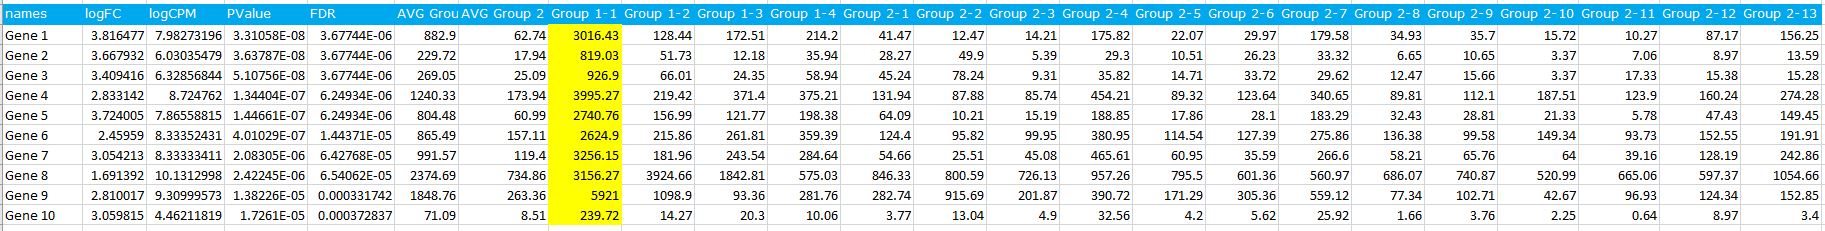
These are not raw data but normalized after edgeR. I list the first few genes with highest fold change, and found one sample is definitely a outlier (highlight in yellow), which cause high fold change (If I remove this outlier, the fold change is only 2 fold-ish.) I am so surprised that the p value and FDR are both extremely small even with an outlier.
Is it common issue when use edgeR for differential expression?
If it is a real issue, how could I find out outlier if I have a large set samples (eg, >100 samples) for data analysis?
We usually use DEseq2 for DE, DEseq2 can identify outlier and report NA for p value.
Thanks,

Hello
Did you resolve your problem?
I have similar a behaviour with use edgeR. If i have one outlier in one of my four biological replicates the program takes it as DE gene. I don't understand why this happen, but seem to be common
am thinking to changue to deseq2
Hi swbarnes2,
I have exactly the same issue here. Genes that have an outlier value in one of the compared conditions are considered as DE by edgeR (small P-value and large abs(logFC)) and I am trying to figure out why.
So i calculated the log2 Fold Change based on the CPM mean values of the compared conditions and I figured out that it is similar to the one calculated by edgeR.
So edgeR's LogFC is similar to log(meanCPMa/meanCPMb) with the only difference that it is adjusted so genes with low counts do not usually have big abs(logFC). Maybe it would be useful to calculate the logFC of the CPM medians which accounts for the outlier samples. However if we use that, what's the point of using edgeR at all?
It would be really helpful if you could tell us what did you do eventually. Did you find any further solution? Did you switch to DESeq2?
Thanks.
Please use the "ADD COMMENT" button to add comments.