Differences between RTCGA and TCGAbiolinks data
4
5
Entering edit mode
5.9 years ago
atakanekiz ▴ 310

Hello Biostars community,

I'm trying to analyze miRNASeq data of TCGA melanoma (SKCM) samples. This is a prototype analysis in which I picked hsa-mir-155 and looked at how its expression is correlated with survival. My end goal is expanding this analysis to other cancer types also focusing on other miRNAs.

I performed my analyses with two of the popular packages in R (RTCGA and TCGAbiolinks) and obtained quite different results. I'm trying to make sense of what might be causing the different results. Any help is appreciated. For comparison purposes, I'm attaching some figures and my codes as well.

Kaplan-Meier curves 
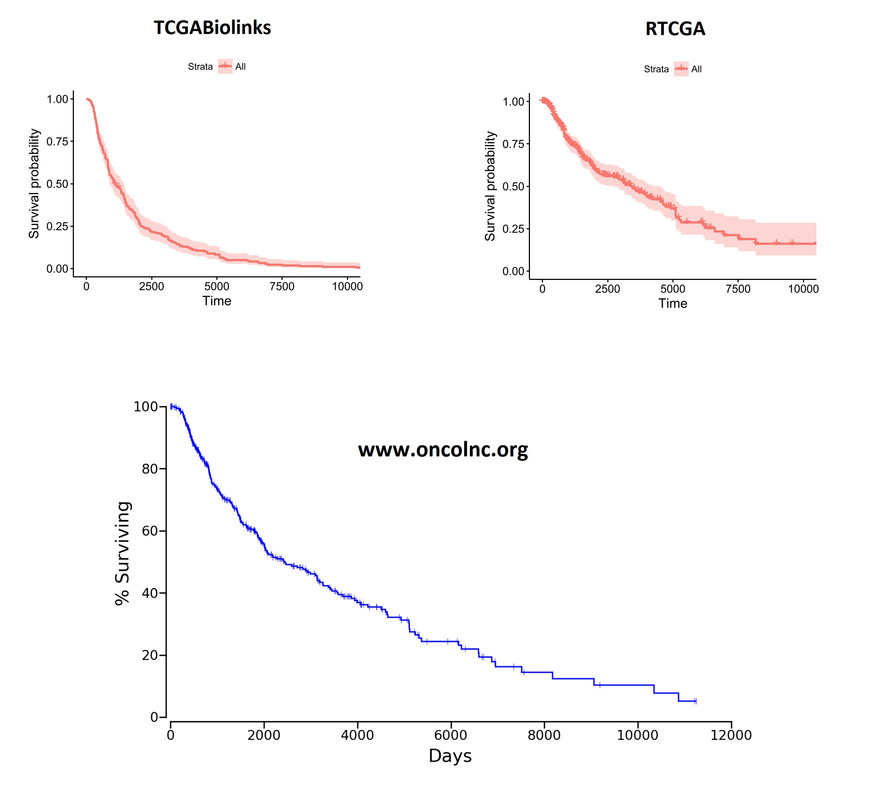
Overall Kaplan-Meier curves look quite different. These plots were generated on the whole cohort (unsegregated for any parameter). I'm including the plot from oncoLNC.org database as well for comparison purposes. RTCGA looks more like the oncoLNC curve.

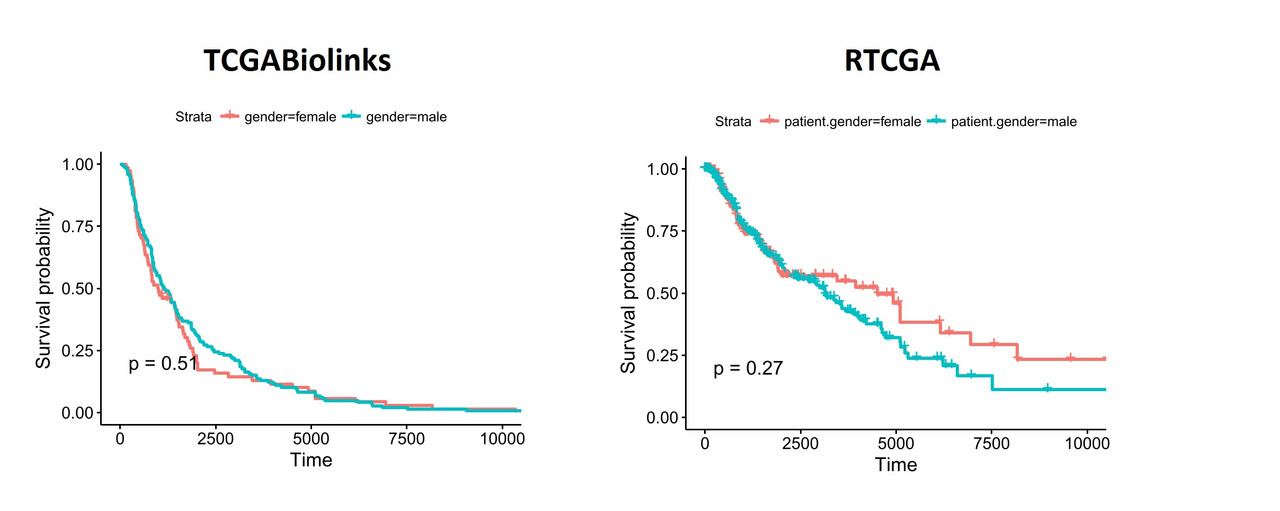
You can see similar differences when the data is segregated based on patient.gender: KM_curves_per_gender

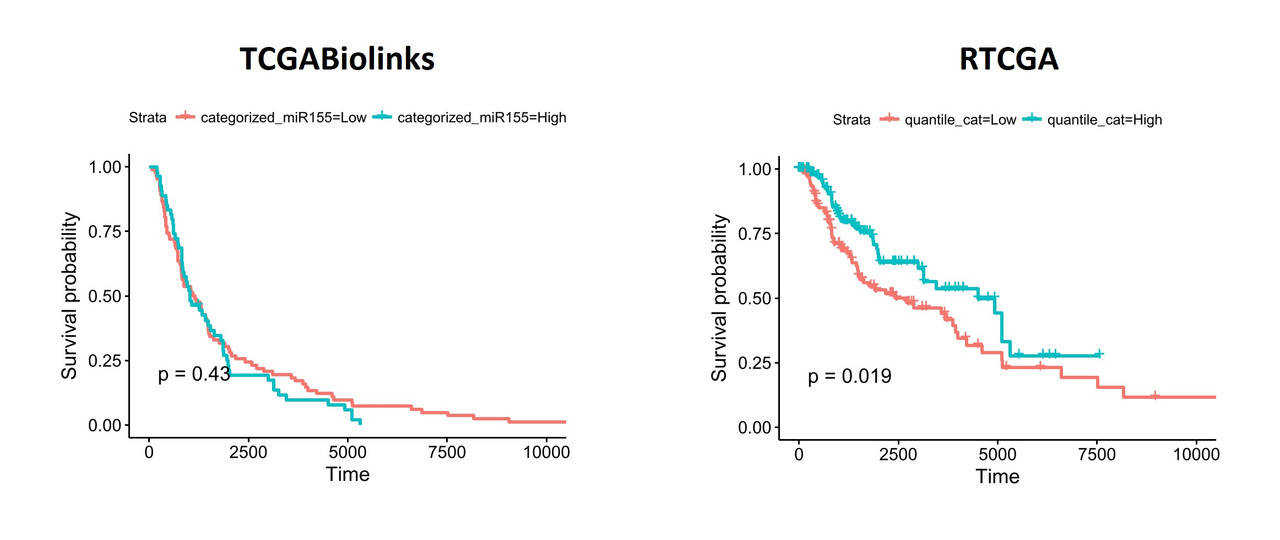
When I segregate patients based on the expression of hsa-mir-155 (top and bottom thirds), the differences become more obvious: mir155_top_bottom_thirds

To understand what might be different in the datasets I exported the data from both packages and performed a comparison. Linked excel file shows the comparisons including clinical details (days_to_death and days_to_last_follow_up) and gene expression values of hsa-mir-155 (both read_count and reads_per_million_miRNA. I noticed that there are considerable differences between two datasets. I'm pretty sure, the way I organized the data is ok and I don't think the differences are due a mistake in data manipulation in R.

The code I used for analyses can be found at RTCGA_v1 and TCGABiolinks_v1

Please let me know why you think there is a discrepancy here. I'm pretty new to this type of analyses and hopefully, I didn't miss something silly.

Thank you very much in advance for your insights,

Atakan

R miRNASeq RNA-Seq Survival analysis • 4.0k views
ADD COMMENT
3
Entering edit mode
5.9 years ago
atakanekiz ▴ 310

Alright, I think I figured out what's going on.

The biggest difference in the results was caused by a missed point during pre-processing. Please see below:

RTCGA features an already preprocessed data frame with clinical parameters. In this data frame there is a times variable that combines both days_to_death and days_to_last_follow_up. That way you can provide times variable into the survfit() function and get the data in one step. In TCGAbiolinks data I needed to create this variable myself. Previously I overlooked this point, and I fitted the survival model only by using days_to_death variable. This effectively discards data from censored and alive patients skewing the results.

I also compared legacy and harmonized miRNA datasets by using TCGAbiolinks package. Results are shown below all side by side. As an example, two different parameters are plotted: patient.gender and hsa-mir-155 expression. harmonized and legacy data uses the same clinical annotation file, that's why gender plots look the same. With this realization, RTCGA and TCGAbiolinks are giving comparable results. Whew!

KM comparison

Thank you all for your insights!

Best,

Atakan

ADD COMMENT
0
Entering edit mode

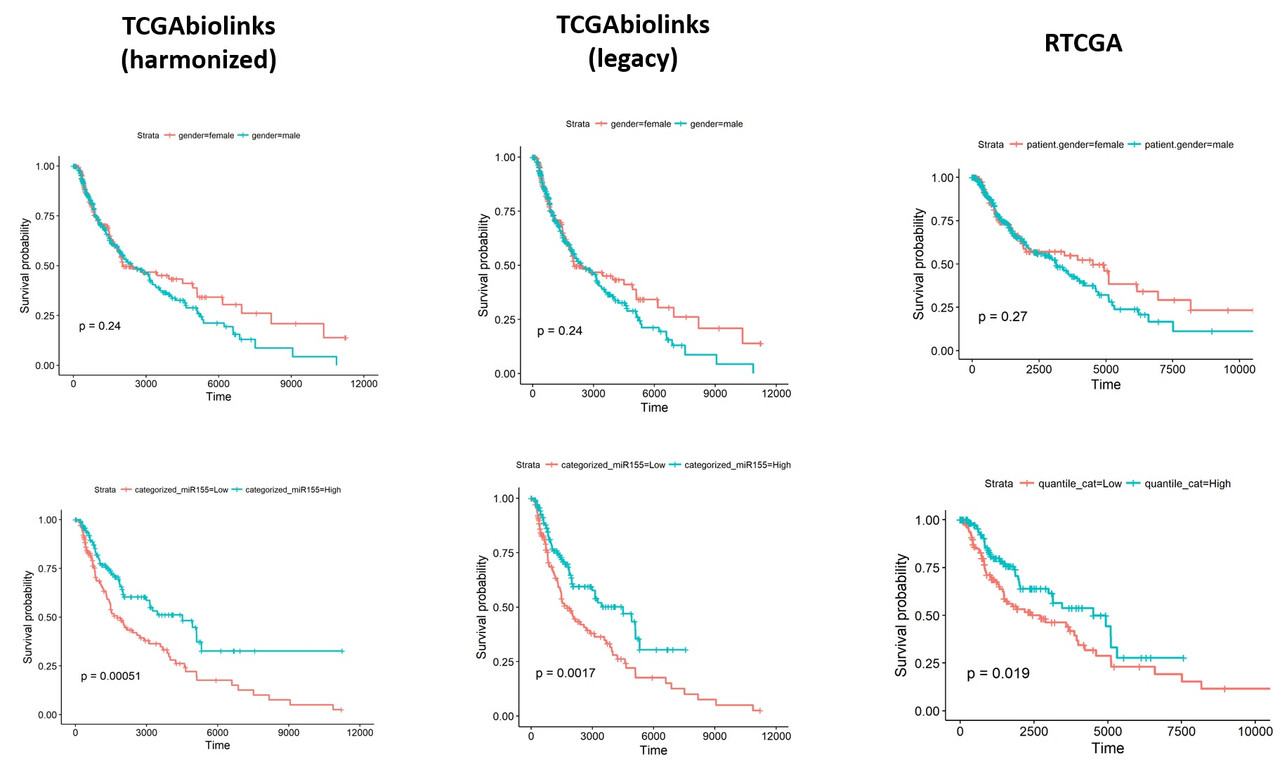
Thank you very much for the update

ADD REPLY
0
Entering edit mode

Dear atakanekiz,

it is nice to hear that you processed your data and find possible solutions on this matter-just an additional comment, in case you haven't used or tried the function TCGAanalyze_SurvivalKM- i think that includes anything you searched, as also the TCGAanalyze_survival -

Best,

Efstathios

ADD REPLY
1
Entering edit mode

Hello guys. As you are both using TCGAbiolinks, perhaps you could assist here: TCGAbiolinks TCGA-BRCA RNA-seq clinical data ?

I only used TCGAbiolinks once, a few years ago.

ADD REPLY
5
Entering edit mode
5.9 years ago

Hi Atakan,

Kudos ('well done') to you for exploring this. For many of the more experienced people here, discrepancies like this are not surprising. For newcomers, they can be quite surprising.

The one thing that I'll say about the TCGA data is that it's constantly evolving, even though the main part of the project finished long ago. If I pulled all data for SKCM 1 year ago, processed it in R, and then did survival analysis, I have no doubt that I'd get a different result than if I repeated the same thing today. New samples may be added to the online repositories and/or clinical data may be updated with new information. If you look in your Excel file, you'll see discrepancies even on people who are alive/dead. Right now, the TCGA has been even re-ananalysing data, for example, much of the RNA-seq data. They refer to this as 'harmonized' data.

This becomes more problematic when packages like TCGAbiolinks and RTCGA, which are 'third party' users of TCGA data, do not update their data. Thus, they invariably reflect a 'snapshot' of TCGA data that was taken during the release of these packages.

This just ever more enforces the importance of version control and just confirms to me at least that i'm better off obtaining my own data direct from the GDC Data Portal or GDC Legacy Archive.

Kevin

ADD COMMENT
0
Entering edit mode

Hi Kevin,

Thank you for your answer. This was along the same lines as what I was thinking. The data of RTCGA is from 2015-11-01snapshot. If I'm understanding correctly, TCGAbiolinks downloads the most updated data directly from GDC. I used the harmonized data instead of the legacy version from TCGA to ensure the data pulled via TGCAbiolinks is up-to-date. Do you know if there is some sort of log of changes in different releases to trace this back?

Also, can you please let me know about your approach for obtaining the most recent data from RTCGA for survival analyses?

ADD REPLY
0
Entering edit mode

Yes, there are indeed release notes, for both the GDC Data Portal (mostly technical updates) and also the GDC generally (more related to the biology of the data stored):

It's likely you'll find the changes relating to your work in the general notes. Looking through them, there are many references to the clinical data. Useful to have this.

ADD REPLY
3
Entering edit mode
5.9 years ago
svlachavas ▴ 790

Just to add on the already great answer from Kevin-

actually, as a very frequent user of the TCGAbiolinks R package, the creators of the package indeed update very frequently their results, as they use the GDC database and daily correct or update a lot of information-as much possible as-moreover, the most important points here that i would like to highlight, as i have never used the RTCGA package:

1) Have you noticed differences and similarities about the genomes used ? the data that you retreive are in both cases harmonized/provinsional data or legacy-old TCGA ? also the preprocessing protocols are the same ?

2) The miRNASeq data you have analyzed is in the same "data ttype" ? for example RSEM counts ?

3) The segregation and subsequent clustering of patients based on the specific hsa-mir-155 you mentioned, is the same for both packages ? and i suppose that you separated the groups, for example based on the median value of this mir ? or something different implemented in the packages ? For example, TCGAbiolinks has 2 separate functions for survival analysis and grouping of samples based on a unique gene expression, etc ?

4) Are you certain that the same survival R packages and relative survival functions are used ?

I hope that this might adresses any issues, but probably you would have already check them-

Best,

Efstathios-Iason

ADD COMMENT
0
Entering edit mode

Hi Efstathios-Iason,

Great questions. Let me answer as much as I can:

1) TCGAbiolinks package fetched the harmonized data but I'm pretty sure RTCGA uses legacy data (from 2015-11-01 release). I knew this would potentially introduce variation, but didn't expect it would be this big.

2) Yes in both cases, I extracted reads_per_million data for survival analyses. In comparison file, I also compared raw read_counts and reads_per_million as well, and there were differences between two datasets in both cases.

3) I segregated patients based on the top and bottom third chunks. Numbers fell into these bins were similar (around 146 patients) give or take between approaches.

4) In both cases, I used the ggsurvplot function. So statistical fit should be technically the same. I really just used two packages to retrieve data in the beginning. Then I performed appropriate data manipulation steps to prepare the data to load into ggsurvplot function.

I guess at the end of the day I expected not exactly the same, but similar results when I used these two packages. Apparently, these differences can throw off the analyses big time!

Atakan

ADD REPLY
1
Entering edit mode

Dear Atakaneziz,

yes, from your description above even only the difference in source data could change significantly the results-i mean for example, the harmonized data include more patients, as also keep in mind that the clinical data could have updates that could significantly alter the results-so, in my opinion i would definately go with the latest updates, based on the GDC resource. Moreover, i doubt that read_count and reads_per_million_miRNA are arguably the same, as if i understood these are belong relatively to the legacy and the other to the harmonized version ?

ADD REPLY
0
Entering edit mode

Hi svlachavas,

Yes I think the main difference between RTCGA datasets and the ones acquired with TCGAbiolinks is that the former has the legacy version whereas the latter pulls out the most recent harmonized data from GDC. I will run the analyses with legacy data by using TCGAbiolinks and update here what I find.

As for the read_count vs reads_per_million_data... You are right in that they are not the same at all. reads_per_million_miRNA is a within-sample normalized data type which takes the read depth/total read counts in account. For my analyses I think reads_per_million_miRNA is more appropriate and I used this type of data in both cases. Thanks for your insights!

ADD REPLY
1
Entering edit mode
5.9 years ago
atakanekiz ▴ 310

Today I met with few bioinformaticians at my institute and got some good suggestions. I will perform more analyses to fully understand what's going on but as a summary:

1) The main difference is potentially caused by the utilization of harmonized data (via TCGAbiolinks) vs legacy data (from RTCGA). I will run the analyses with legacy data downloaded with TCGAbiolinks package and will see how it will affect the results.

2) My survival fit takes only days_to_death into account but not the days_to_last_follow_up in the case of alive patients. I must have missed this previously. My survival plots are likely to be underestimated since censored alive patients won't be showing up due to NA values in their days_to_death column. This might also have potentially introduced variation into the analyses since, in harmonized data, follow-up times were longer than the legacy data.

3) Still unknown is why we are having different read_counts per gene of interest in miRNASeq data. This number shouldn't be affected by the normalization steps that the harmonization pipelines might introduce.

I will update this thread with new findings in a day or two.

Best, Atakan

ADD COMMENT
2
Entering edit mode

Hi Atakan, thanks for the follow-up. I was not aware that TCGAbiolinks is still being updated, but that's good to hear.

To explain the differences in read counts, it could be one of the following:

  • different versions of software (e.g. DESeq2 has been in constant development since it was first released), which can include modifications to normalisation methods
  • as TCGAbiolinks and RTCGA appear to be using different numbers of samples, this would also affect the normalisation 'factors' and other estimates, like dispersion, which would translate into slightly different normalised counts. Raw counts should be the same if taking the same file

On the final point that I make, TCGA appear to have been re-processing all RNA-seq samples in order to produce RSEM 'raw' cunts, which is good. Prior to this, there were different count types available for different cancers, depending on where the work was done.

ADD REPLY

Login before adding your answer.

Traffic: 1925 users visited in the last hour
Help About
FAQ
Access RSS
API
Stats

Use of this site constitutes acceptance of our User Agreement and Privacy Policy.

Powered by the version 2.3.6