Making row and column names visible on heatmap.
2
0
Entering edit mode
5.6 years ago
lokraj2003 ▴ 120

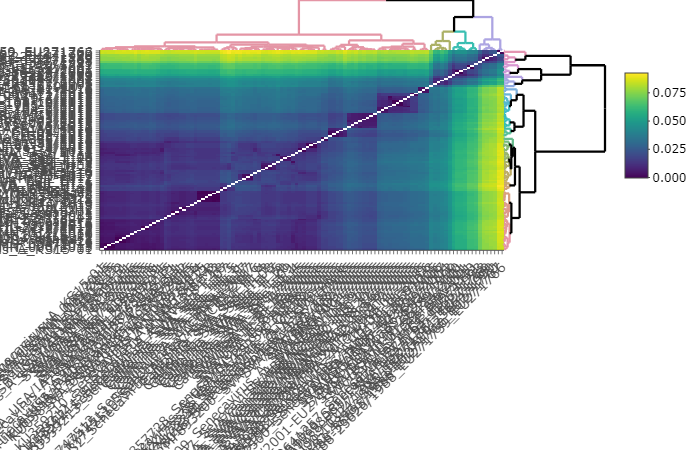
I am using Shiny heatmap tool to generate a heatmap from a matrix that has 109 rows and 109 columns. I got a nice heatmap but there is no way I can see row or column names. Is there any way to format this graph so that row and column names are visible.

heatmap

Heatmap R • 10k views
ADD COMMENT
2
Entering edit mode

HI! I appreciate that this has been a long time since your question, and may not directly answer your question. But I just developed a Julia-based GUI tool to plot heatmaps based on Python's Seaborn package, just wanted to share it here. It's not based, but you may find it useful. Takes 10-15 min to get it running. Very minimal/no coding is required for this. This is the link with the full instructions and information:

https://github.com/srgk26/easy_plotting.app

ADD REPLY
1
Entering edit mode

Thanks Guys. I will try the links !

ADD REPLY
3
Entering edit mode
5.6 years ago

Yikes, why would you use such a tool? Just use the heatmap.2 function from gplots package in R. The size of the labels can then be controlled by either modifying the dimensions of the saved output file and/or via the cexRow and cexCol parameters.

Some examples:

ADD COMMENT
1
Entering edit mode
5.6 years ago

See also this previous post listing various heatmap packages and links to tutorials. As mentioned, typically, one makes text readable by controlling both the plot and the text sizes.

ADD COMMENT

Login before adding your answer.

Traffic: 3720 users visited in the last hour
Help About
FAQ
Access RSS
API
Stats

Use of this site constitutes acceptance of our User Agreement and Privacy Policy.

Powered by the version 2.3.6