VCF Output file column explanation
1
0
Entering edit mode
5.6 years ago
kathrine.tan ▴ 10

enter image description herescreenshot of my annoVar output

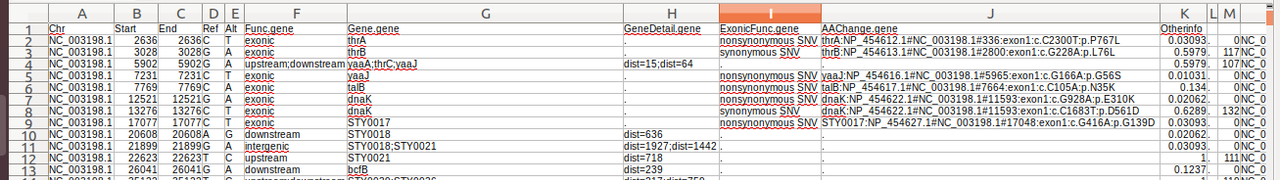
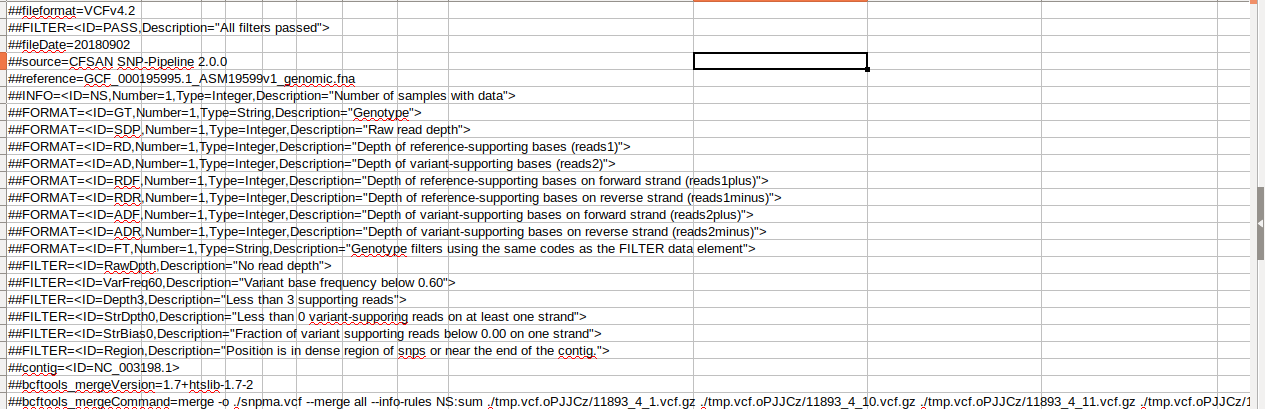
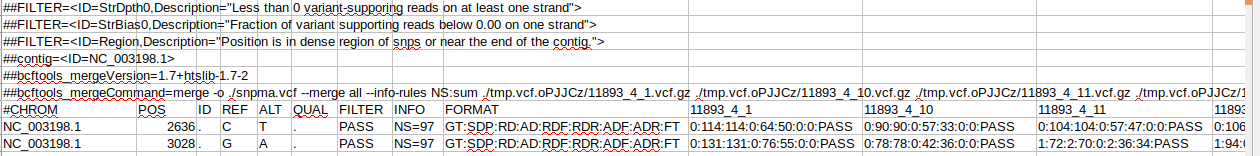
I am new to the annotation of variants using annoVar. I try to understand the values listed in the column "Otherinfo" (Columns : K & M) by reading the documentation of annoVar. However I am still not clear about how these values were generated.

SNP genome gene annoVar • 3.4k views
ADD COMMENT
0
Entering edit mode

The column K looks like SIFT score. This information come from the database you add in you command line for the annotation.

ADD REPLY
0
Entering edit mode

Dear Titus,

Thanks for answering. I will try to look at it.

K

ADD REPLY
0
Entering edit mode
5.6 years ago

Titus, I am not sure about that. Other information does not come from the databases specified in the command line. It comes from the extra columns that were in your input file:

--otherinfo                 print out otherinfo (infomration after fifth column in queryfile)

kathrine.tan, go back to your input file (input file to ANNOVAR), and there you will see to what the other information relates.

Kevin

ADD COMMENT
0
Entering edit mode

and also please post function/command options used to generate annovar input (probably, from VCF). kathrine.tan

ADD REPLY
0
Entering edit mode

Dear Kevin, Thanks for answering. Here is a the command I used to generate the output. The input was a vcf file.

table_annovar.pl -protocol gene -operation g -buildver ct18 -vcfinput PASS.vcf ct18db_180915/

NOTICE: Running with system command <convert2annovar.pl -includeinfo="" -allsample="" -withfreq="" -format="" vcf4="" pass.vcf="" &gt;="" pass.vcf.avinput=""> NOTICE: Finished reading 1888 lines from VCF file NOTICE: A total of 1863 locus in VCF file passed QC threshold, representing 1863 SNPs (1612 transitions and 251 transversions) and 0 indels/substitutions NOTICE: Finished writing allele frequencies based on 180711 SNP genotypes (156364 transitions and 24347 transversions) and 0 indels/substitutions for 97 samples

Could the column K be the allele frequencies?

Here are some screenshots of the vcf file: enter image description here

enter image description here

K

ADD REPLY
0
Entering edit mode

I see, you originally tried to annotate a VCF, but ANNOVAR then detected this and automatically converted it to ANNOVAR format via

convert2annovar.pl -includeinfo="" -allsample="" -withfreq="" -format="" vcf4="" pass.vcf="" &gt;="" pass.vcf.avinput=""

Specifically, it uses these command-line parameters:

--includeinfo               include supporting information in output
--withfreq                  for --allsample, print frequency information instead (for vcf4 format)

So, your column K does appear to be allele frequencies (of your sample cohort). You should check a few examples just to be sure.

ADD REPLY
1
Entering edit mode

Dear Kevin,

Thank you so much. I will check it again.

K

ADD REPLY

Login before adding your answer.

Traffic: 2845 users visited in the last hour
Help About
FAQ
Access RSS
API
Stats

Use of this site constitutes acceptance of our User Agreement and Privacy Policy.

Powered by the version 2.3.6