How to add stats. to volcano plot?
1
2
Entering edit mode
5.5 years ago
ahmad mousavi ▴ 800

Hi

How can I add statistics to volcano plot in R for gene expression? Statistics like up and down number of genes and highly up and down genes.

use example code for that :

library(ggplot2)
fold_changes <- c(rnorm(20000, 0, 2))
pvalues <- runif(n=20000, min=1e-50, max=.1)
dif <- data.frame(fc =fold_changes,pv =pvalues)
dif$thershold <- ifelse(dif$fc > 1 & dif$pv < 0.01, "red", 
                        ifelse(dif$fc < -1 & dif$pv < 0.01, -1, "blue"))
ggplot(data=dif, aes(x=fc, y=-log10(pv))) +
  geom_point( size=1 ,aes(color=as.factor(thershold))) +
  theme(legend.position = "none") +
  xlim(c(-10, 10)) + ylim(c(0, 15)) +
  xlab("log2 fold change") + ylab("-log10 p-value")  + theme_bw()+
  theme(panel.grid.major = element_blank(), 
        panel.grid.minor = element_blank(),)

Like below image:

enter image description here

RNA-Seq R ggplot2 plot • 6.2k views
ADD COMMENT
4
Entering edit mode
5.5 years ago

try annotate:

ggplot(data=dif, aes(x=fc, y=-log10(pv))) +
    geom_point( size=1 ,aes(color=as.factor(thershold))) +
    xlim(c(-10, 10)) + ylim(c(0, 6)) +
    xlab("log2 fold change") + 
    ylab("-log10 p-value")  + 
    annotate("label", x =c(-8,5), y = 4.75, label = c("400","120"), col=c("red","steelblue"))+
    annotate("text", x =c(-8,5), y = 5, label = c("50 FC>4","8FC <-4"))+
    theme_bw()+
    theme(panel.grid.major = element_blank(), 
          panel.grid.minor = element_blank(),
          legend.position = "none")

Rplot01

By editing x and y coordinates, you can move the text around graph, in x and y directions.

ADD COMMENT
0
Entering edit mode

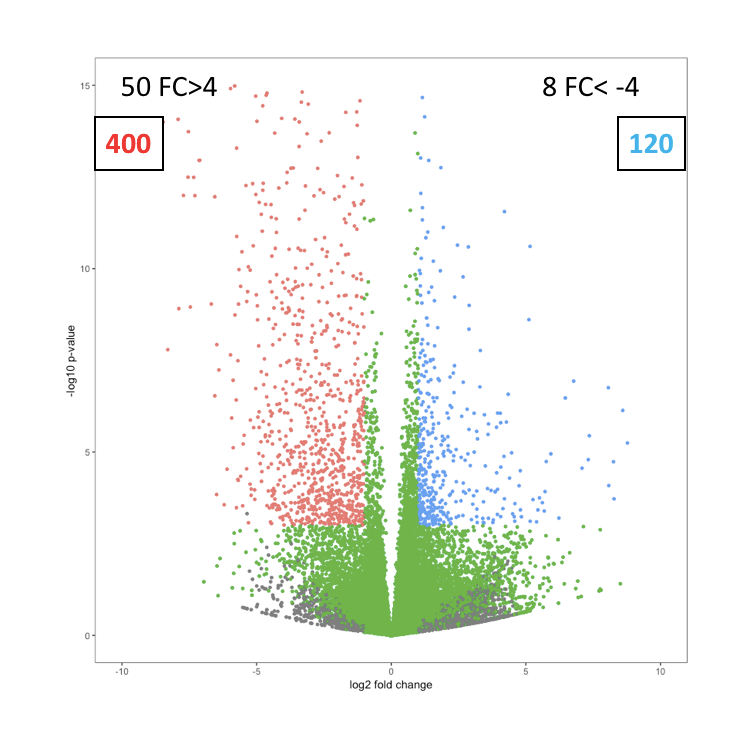
Going one step further, we could calculate the x-y positions for label and text, instead of hard coding them.

ADD REPLY
0
Entering edit mode

Hi

How can we choose proper x-y coordination in code like my example image?

Thanks

ADD REPLY
0
Entering edit mode

thank you so much. It is helpful.

ADD REPLY
1
Entering edit mode

No problem. You have posted input data, code and output expected. This helps in understanding the issue better and resolve it faster. ahmad.moousavi

ADD REPLY

Login before adding your answer.

Traffic: 1692 users visited in the last hour
Help About
FAQ
Access RSS
API
Stats

Use of this site constitutes acceptance of our User Agreement and Privacy Policy.

Powered by the version 2.3.6