Dot plots for biomarkers
1
0
Entering edit mode
5.3 years ago
Nate ▴ 10

dot plots

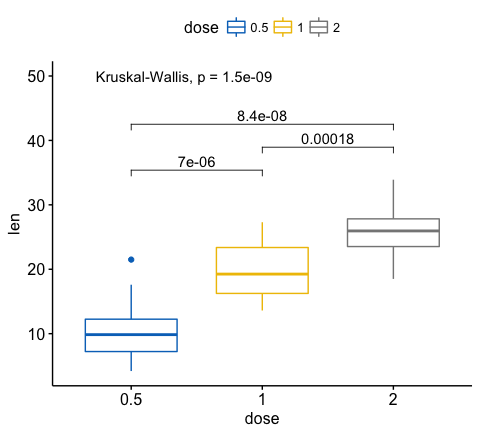
I am looking to create plots like this where p-value is shown at the top. Does anyone know any good package that can generate graphs as such easily? I know ggplot2 is possible, but is that the only way? It is because it is long!

R • 1.5k views
ADD COMMENT

Login before adding your answer.

Traffic: 2517 users visited in the last hour
Help About
FAQ
Access RSS
API
Stats

Use of this site constitutes acceptance of our User Agreement and Privacy Policy.

Powered by the version 2.3.6