I use dimensionality reduction a lot, though not for scRNA-seq analysis. My suggestions will be general, though I hope it is still useful to you.
Right off the bat, I'd like to dispense with the notion that there is a right or wrong method for dimensionality reduction. All methods will work fine for a dataset that has two well-defined groups of data points, while probably none will work with a dataset that has hundreds of poorly separable groups of data points. What I use in a particular case depends on: 1) available time; 2) the point I need to make in terms of visualization; 3) whether I need to repeat the same analysis later on new data.
To make this post reasonable in length, I will illustrate this on t-SNE vs PCA. Visualization argument first: below are two reduced-dimensionality visualizations of the MNIST dataset that has 10 clusters - one for each of 0-9 digits.
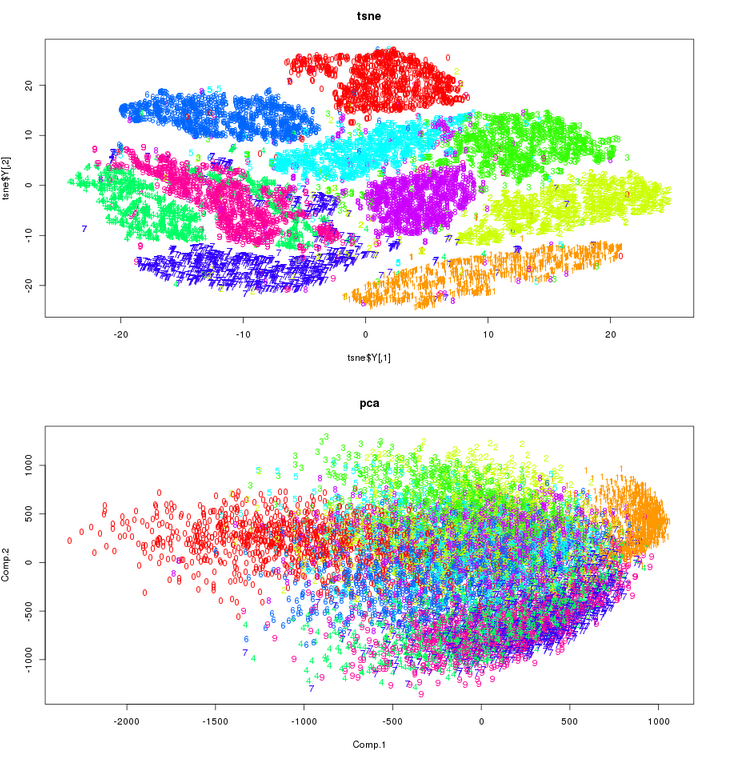
Most people will agree that t-SNE does a better job than PCA, and this is not the only dataset where that argument can be made. So why don't we replace PCA with t-SNE? There are several reasons, and I will only cover most important ones. At a risk of stating the obvious, t-SNE is non-deterministic (the S in the acronym stands for stochastic). That means that two independent t-SNE runs will not yield the same solution. They will be very similar for most datasets, but not identical. PCA is deterministic, and therefore reproducible. PCA takes a minute or less even for very large datasets. t-SNE becomes very difficult for datasets larger than 50-100K points, and would take many days for datasets > 1-10 million points. PCA has no tunable parameters: give it a number of dimensions (principal components) you wish, and off it goes. One can even specify the target percent of explained variance we wish to get rather than number of dimensions. t-SNE-generated embeddings, on the other hand, depend quite a bit on a parameter called perplexity. But this is a kicker to most people that prefer PCA over t-SNE: PCA is parametric, and once we build a model it can be used on unseen data. In its original and still most widely used implementation, t-SNE is non-parametric. That means that model parameters can't be saved and later used to embed new data.
A larger point is that some methods may produce more visually appealing embedding, while others are faster or more general. I suggest you try many methods and see which one works best for your particular needs. There is a long list of available implementations here, and I also want to mention UMAP because it is similar to t-SNE but faster and more scalable to large datasets.
Lastly, it is worth mentioning that neural networks, specifically autoencoders, can do a spectacular job when it comes to non-linear dimensionality reduction. See here how an autoencoder compares to PCA on MNIST data.


Thanks for the insightful comment. I'm trying to get a sense if there is any rationale other than "looks ok" to decide which dimensionality reduction methods to use for downstream computations, such as trajectory inference. My understanding of the popular MST method is tenuous at best at the moment and apart from choosing the visualization that seems to least contradict our prior expectations (which is not necessarily the most gratifying approach for me), I don't really have a good intuition of how the different dimensionality reduction metrics influence the lineage identification.
Although all dimensionality reduction techniques do what their name implies, they employ different minimization strategies. For example: an autoencoder minimizes the reconstruction error, and its embedding is just a byproduct of that process; t-SNE specifically attempts to preserve local neighborhood distance while finding lower-space embedding; PCA converts the data along a set of linearly uncorrelated principal components. Which of these transformations work best for the data depends on our goals. Although the quality of dimensionality reduction can be quantified, there are other considerations.
This is a dataset with two groups of partially overlapping data points. The reconstruction error is lower for an autoencoder than it is for PCA, so that is objectively a better method. That said, the question often is which of them better conveys the underlying nature of data. In other cases, the visualization will be very similar regardless of the method.
I suggest you explore different methods and compare their representations. If all of them are similar, that should make your subsequent interpretation less biased. Again, t-SNE tends to highlight local data structure better than other methods, which is why it has become so popular lately. However, t-SNE struggles with truly high-dimensional data. In some cases, it is a good strategy to reduce the dimensionality to 50 or so using PCA or an autoencoder, followed by using t-SNE to map it into 2 or 3 dimensions. I think it is always good to start with methods that provide a quick answer (PCA) before moving on to more time-demanding approaches.