Hi @mschmid,
You can create plots like the ones you ask with [karyoploteR]. It's not trivial, but it's doable.
The key is to define a custom genome with a single chromosome "Cust" going from 1 to the length of the sequence, and then plot the sequence and the bed files on it.
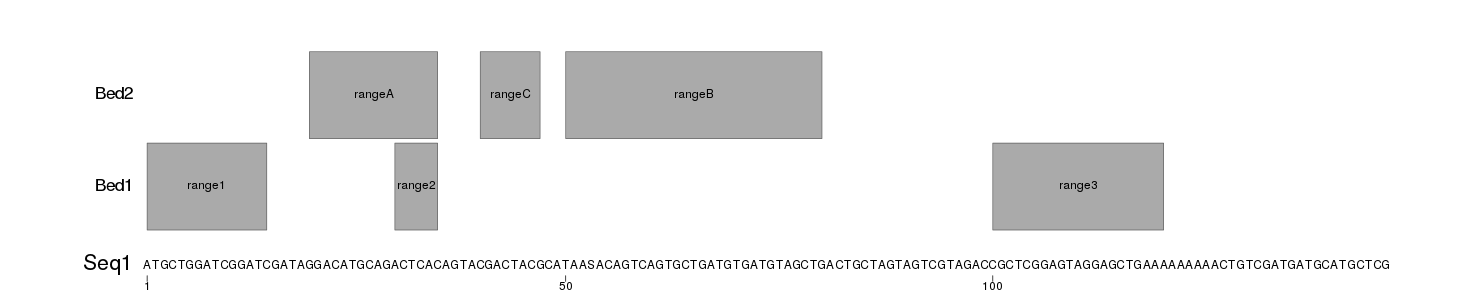
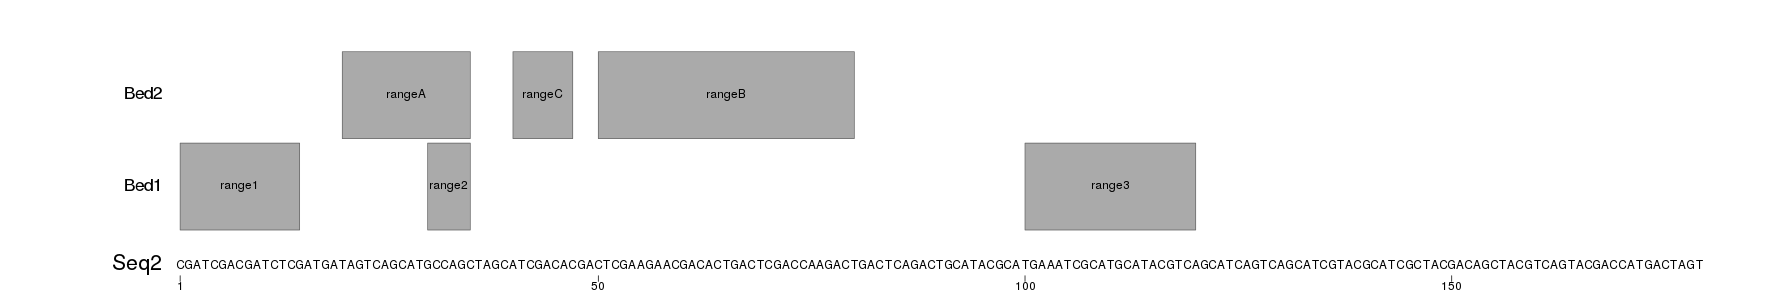
I have created an example with a fasta file (seqs.fa) with two sequences and two ranges files (Bed1.txt and Bed2.txt) with 3 ranges each that will be plotted on top of each sequence. The ranges files are txt and no bed to include the range name in the fourth column.
The following code reads the sequences from the fasta file with Biostrings::readDNAStringSet and the ranges with regioneR::toGRanges. It creates a png file for each sequence adjusting the the png size to the length of the file to the sequence text is readable. To plot, it will defines a custom genome with toGRanges creates the plot with plotKaryotype and then uses kpText and kpRect to plot the sequence and the ranges.
library(karyoploteR)
library(Biostrings)

#Read the fasta
seqs <- Biostrings::readDNAStringSet("seqs.fa")

#read the ranges
regs <- list(Bed1=toGRanges("Bed1.txt"), Bed2=toGRanges("Bed2.txt"))

#Define the plotting parameters (margins, etc...)
pp <- getDefaultPlotParams(1)
pp$ideogramheight <- 0
pp$data1inmargin <- 0
pp$bottommargin <- 20
pp$topmargin <- 20

for(i in seq_along(seqs)) {
  s <- seqs[i]
  seq.name <- names(s)
  seq.len <- width(s)
  seq.chars <- strsplit(x=as.character(s), "")[[1]]

  pngpaste0seq.name, ".png"), width=10*seq.len, height=300)
    #Plot with a custom genome
    custom.genome <- toGRanges("Cust", 1, seq.len)
    kp <- plotKaryotype(genome=custom.genome, ideogram.plotter = NULL, labels.plotter = NULL, plot.params = pp)
    kpAddBaseNumbers(kp, tick.dist = 50, minor.ticks = FALSE, cex = 1)

    #Add the sequence
    kpAddLabels(kp, labels = seq.name, r0 = 0, r1=0.1, cex=1.8)
    for(j in seq_len(seq.len)) {
      kpText(kp, chr="Cust", x = j, y=0.05, labels = seq.chars[j])
    }

    #Add the ranges
    for(j in seq_along(regs)) {
      at <- autotrack(j, length(regs), r0=0.2)
      kpAddLabels(kp, labels = names(regs)[j], r0=at, cex=1.4)
      kpRect(kp, data=regs[[j]], y0=0, y1=1, r0=at, col="#AAAAAA", border="#666666")
      kpPlotNames(kp, data=regs[[j]], labels = mcols(regs[[j]])[,1], position = "center", y0=0, y1=1, r0=at)
    }

  dev.off()
}
This will produce images like these
Seq1.png
Seq2.png
You would need to customize the appearance, and the data loading, but you should be able to build upon this. You can find more information in the karyoploteR tutorial.


Not python or R but IGV may be able do this.
Can it export the individual contigs to a PDF? -- EDIT: And I have to automate this. I can not do this manually :(
Not PDF but you can export images out of IGV programmatically: Automatic IGV snapshot script
One more option here.