Entering edit mode

4.4 years ago
solanum
▴
10
Hi
I performed genome wide assoctiations (linear mixed model) of 640'000 SNPs and transformed phenotypic traits of 160 individuals. After correcting for population structure and kinship, all resulting Q-Q plots looked more or less like this:
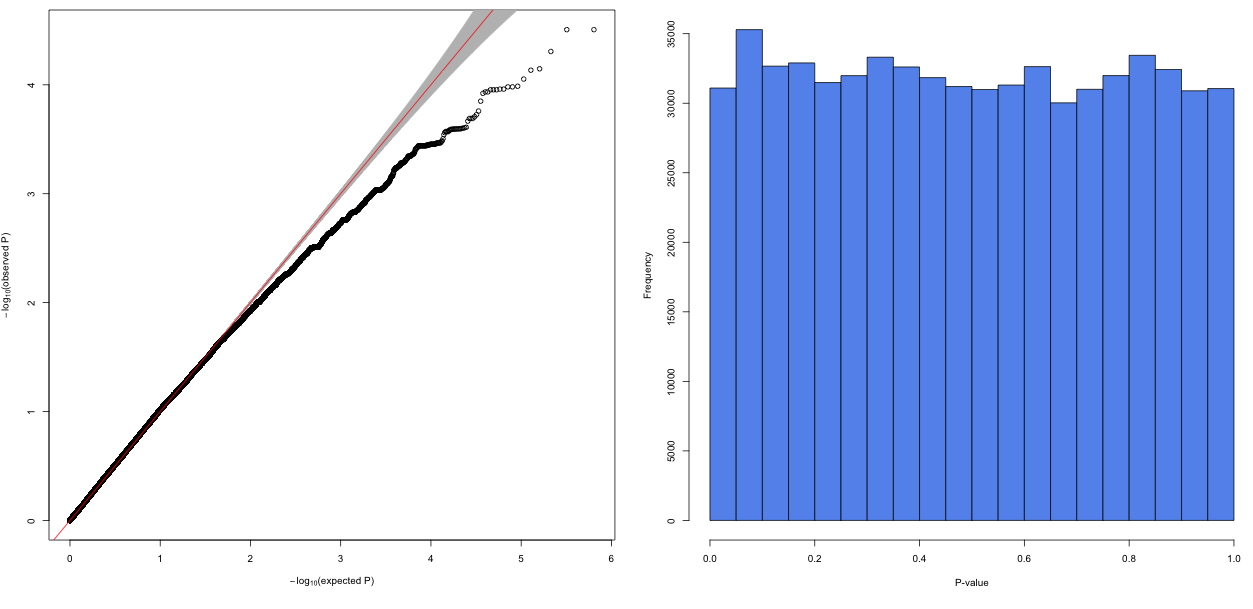
What could possibly cause deflated p-value distributions in GWAS? Changing the number of PCs and adding different random effects did not substantially improve the model.
Many thanks in advance

just a comment: what happens if you apply FDR correction for your p-values? Can you make a plot of your p-values but not as qq but as histogram from 0 to 1 (with e.g. 100 of breaks)?
I updated the figure. FDR-corrected p-values are highly insignificant, as there is no excess of p-values<0.05.
Well, at first - your histogram looks quite uniform there, so I'd wont expect any significant number of "true positives" - otherwise you'd see a small increase of the first left column. I do not like the "bump" in the 2nd column from the left. It looks like all the p-values from the left part which could be significant "migrated" there due to some regularization. Another thing - if you have 1-2 samples as "outliers" (large variability) it will cause over-estimation of residuals variance in your linear model and then all the effects will be "hidden"
I am not a specialist in SNP-array analysis, these are just general considerations which may be totally useless.
Thank you for sharing your thoughts. In this example, I'd not expect any significant SNPs either but I'd expect the p-values to follow the expected p-value distribution better. The "bump" you mentioned is a pattern that occurs also in associations with other traits, what do you mean with regularization?
The term I've used is not actually correct - regularization means another thing, but does not matter. The thing is - you operate with the data which is discrete (presence or absence of a SNP) and you apply (I guess) some sort of linear model there. All these models are normally obtained via continuous approximations to the discrete data (e.g., proportion is modelled with the normal distribution - and it is fine when it is a proportion of 0.5 amongst 10.000 samples, but when it is a proportion of 0.01 or the sample size is 160 - you may expect troubles). So this bump may occur as a consequence of this. Or if you have outliers, or if you use a regularized model (this process I can not describe in a comment). Hidden dependencies may also affect your histogram shape (and there are dependencies).