I am using the BiNGO plugin for Cytoscape to draw GO pathway network and find significant enrichment of GO terms as their tutoir http://cytoscape.wodaklab.org/wiki/Presentations/06_GO. here is my question: how can i put the color scale into the network picture instead of in a separate window?
You can't do what you are asking, not even with the latest Cytoscape release. What I recommend you is to export the images as png or pdf and then use a image editor like Gimp to put them together.
You may consider filing a feature request on Cytoscape's issue tracker to ask them to implement this new feature, or ask to their mailing list directly.
p.d. your question is not specific to the BiNGO plugin but to all Cytoscape. Please use a correct type.
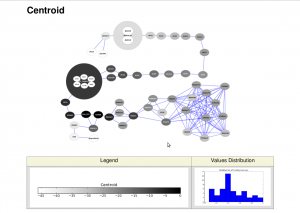
I have managed to do this by using the Cytoscape XMLRPC plugin, then exporting the figure to pdf, generating the legend with python-matplotlib, and collating everythung together with a Restructured Text file: