R package or tool to draw peaks on chromosomes (like in UCSC)
2
0
Entering edit mode
3.7 years ago
blur ▴ 280

Hi,

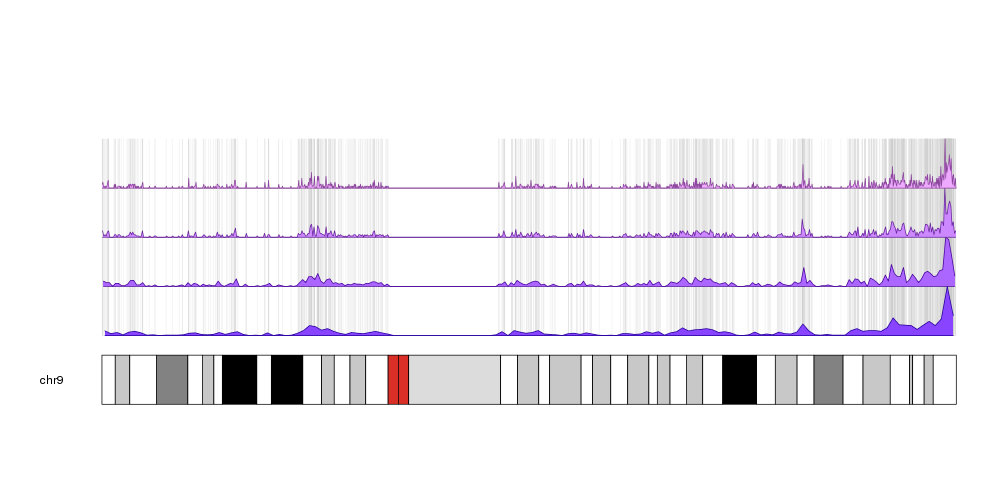
I uploaded peaks into the UCSC genome browser and I can see all of the peaks on the full chromosome. Now I'd like to draw the entire genome, with each chromosome showing the peaks throughout to get a good visual idea of the peaks distribution on the chromosomes. I am looking fir a tool that does this, has anyone any ideas? I assume there must be an option in R to do this.

My peaks are in bed format.

I am not very proficient in R, so any help would be greatly appreciated.

R visualization ucsc • 2.3k views
ADD COMMENT
1
Entering edit mode
3.6 years ago
bernatgel ★ 3.4k

You can also give karyoploteR a try.

It has functions to plot peaks, reads densities and many other either in a whole genome view, in a subset of chromosomes or in a local region view.

There's a karyoploteR tutorial page with examples of this kind of plots. For example:

enter image description here

enter image description here

enter image description here

ADD COMMENT
0
Entering edit mode
3.6 years ago

ChIPseeker has a simple function to do this (covplot).

ADD COMMENT
0
Entering edit mode

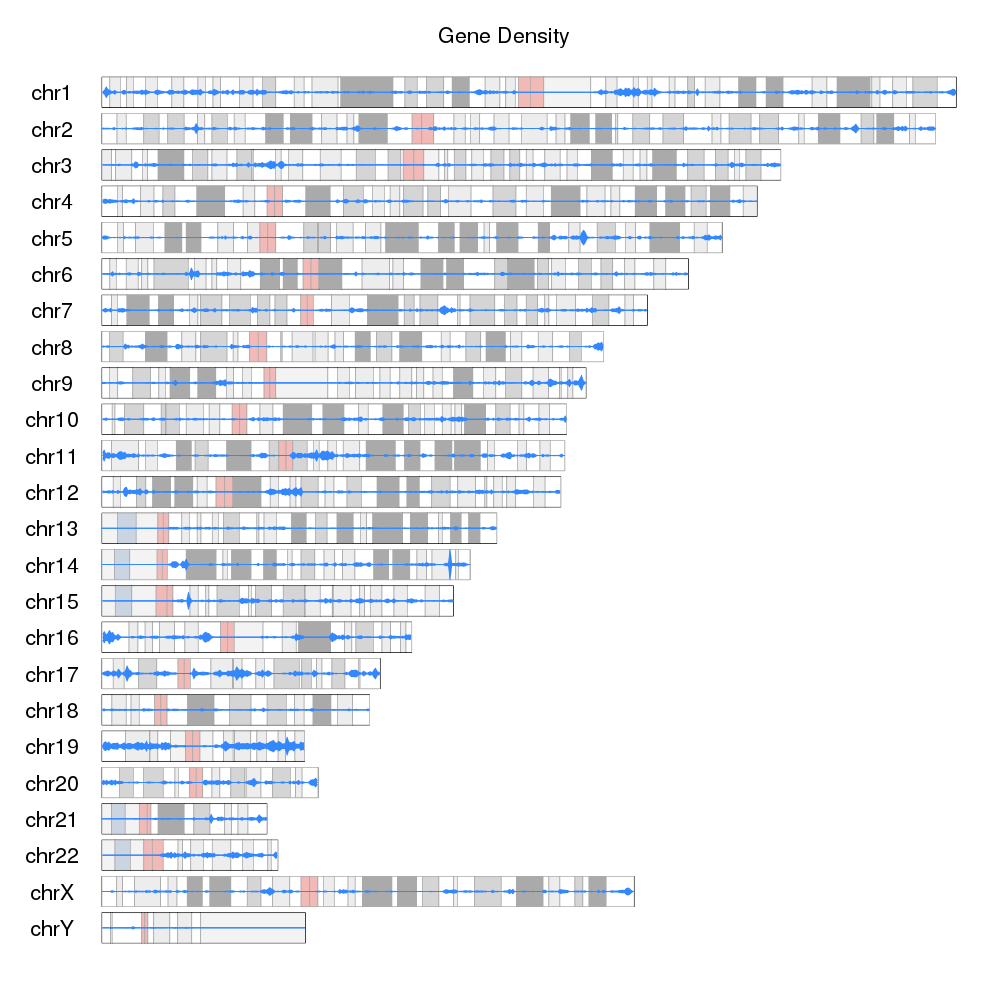
looks great, thanks!

ADD REPLY

Login before adding your answer.

Traffic: 1545 users visited in the last hour
Help About
FAQ
Access RSS
API
Stats

Use of this site constitutes acceptance of our User Agreement and Privacy Policy.

Powered by the version 2.3.6