Question: R: Manhattan Plot of LRT Values Instead Of -Log10(p)
1
0
Entering edit mode
3.6 years ago

Hi all!

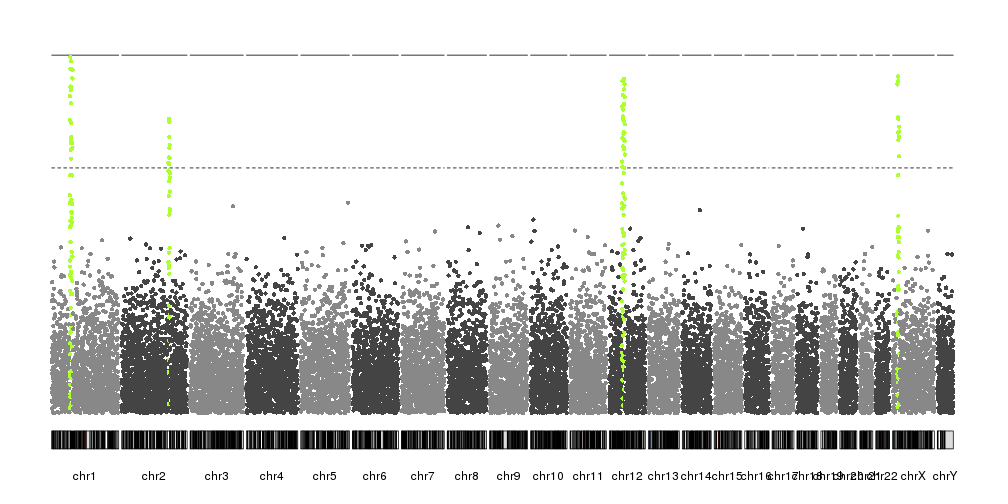
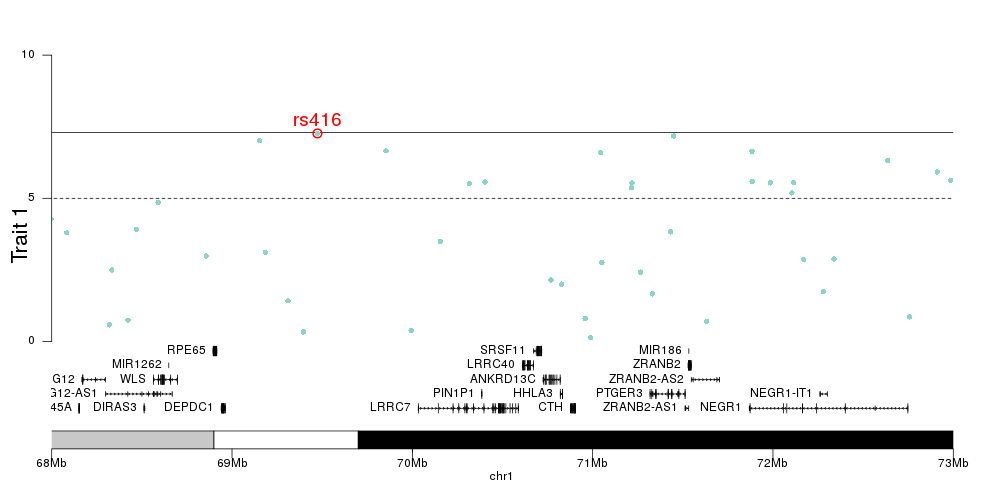
Do you know how to make a manhattan plot of LRT values instead of -log10(p) for regional heritability mapping analysis?

The results file consists of the following columns:

CHR SNP BP LRT

Many thanks!

manhattan LRT values plot • 1.6k views
ADD COMMENT
1
Entering edit mode

I'm guessing the answers here are highly relevant to your case.

ADD REPLY
1
Entering edit mode
3.6 years ago
bernatgel ★ 3.4k

Hi, you might want to take a look at kpPlotManhattan from karyoploteR. With it you can create a manhattan plot with correct x coordinates and can plot any values you want. By default it will transform the values with -log10 but you can disable with with "logp=FALSE".

If you need it, you can also create zoomed plots of smaller regions (peaks, for example) and add other data such as genes or virtually anything else.

manhattan plot made with the karyoploteR R package detail of a small region in a manhattan plot with genes plotted

ADD COMMENT

Login before adding your answer.

Traffic: 1932 users visited in the last hour
Help About
FAQ
Access RSS
API
Stats

Use of this site constitutes acceptance of our User Agreement and Privacy Policy.

Powered by the version 2.3.6