DoHeatmap clusters, Seurat pipeline
1
0
Entering edit mode
3.6 years ago
Morris_Chair ▴ 350

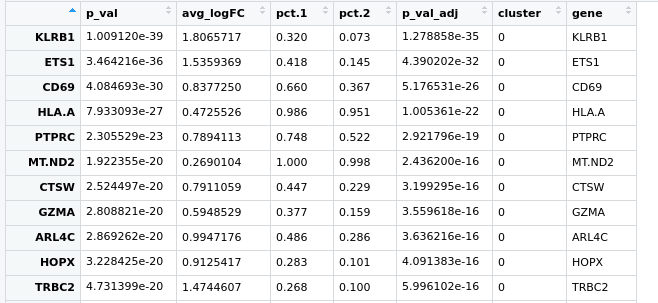
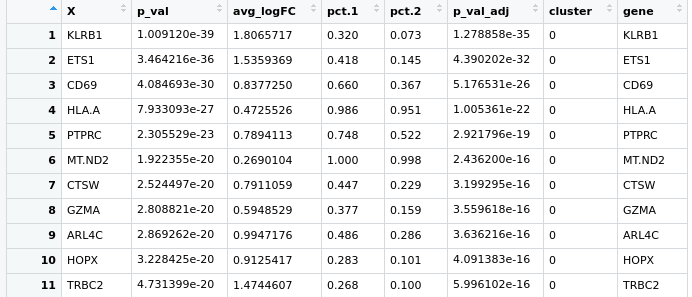
Hello everyone, I have a little problem with Seurat pipeline, I created a heatmap based on the top expressed genes in each cluster using the following code:

pbmc.markers %>% group_by(cluster) %>% top_n(n = 10, wt = avg_logFC)

here is the pic https://ibb.co/zfWD1Wh

it's not clear to me how can I select more genes to represent in this heatmap, if I do more the n=100 doesn't change anything. I have a gene of interest in the cluster 5 which based on the avi_LogFC, is at the position 160th and I'd like to show it here .. do you guys have any suggestion?

thanks for help :)

scRNA-sequencing • 9.4k views
ADD COMMENT
0
Entering edit mode

Hmm could you share the full code you're using to generate the plot? Does pbmc.markers %>% group_by(cluster) %>% top_n(n = 10, wt = avg_logFC) feed directly into the plot, or is this supposed to update pbmc.markers first? (The magrittr pipe is uni-directional here, so it wouldn't update pbmc.markers with filtering criteria here.) As an aside, I would recommend replacing top_n() with slice_max() or slice_min() as appropriate.

ADD REPLY
0
Entering edit mode
3.6 years ago
Morris_Chair ▴ 350

Hi Dunois, here it is the code for calling the heatmap,

pbmc.markers %>% group_by(cluster) %>% top_n(n = 10, wt = avg_logFC)
DoHeatmap(seuratobject, features = top10$gene) + NoLegend()

there is not update of pbmc.markers, how can I do the update with filtering criteria?

using slice_max() I get this error

> top10 <- pbmc.markers %>% group_by(cluster) %>% slice_max(n = 10, wt = avg_logFC)
Error: argument `order_by` is missing, with no default.
Run `rlang::last_error()` to see where the error occurred.
> rlang::last_error()
<error/rlang_error>
argument `order_by` is missing, with no default.
Backtrace:
 1. dplyr::group_by(., cluster)
 9. dplyr::slice_max(., n = 10, wt = avg_logFC)
Run `rlang::last_trace()` to see the full context.

Can you please help me to fix it?

thank you

ADD COMMENT
0
Entering edit mode

So you're filtering from pbmc.markers into top10.

This call here:

top10 <- pbmc.markers %>% group_by(cluster) %>% slice_max(n = 10, wt = avg_logFC)

Should be

 top10 <- pbmc.markers %>% group_by(cluster) %>% slice_max(n = 10, order_by = avg_logFC)

There is no wt parameter in slice_max. Try this with n=200 or something like that and see what it gets you? It could be that the problem is cropping up elsewhere though.

And by "update" I meant feeding the output of that pipe-chain back into pbmc.markers. So it would have looked something like this (note the %<>% as the first pipe):

pbmc.markers %<>% group_by(cluster) %>% slice_max(n = 10, order_by = avg_logFC)

(But this doesn't matter. Just continue with what you have now.)

ADD REPLY
0
Entering edit mode

I tried but doesn't change much, or at least doesn't show what I'd like to :/ it seems that there is a filtering for a limited number of genes so that if I put n=100 else n=1000, I dont' have more than a set of genes listed

There are omitted features, but it's not included the one of my interest

thank you

ADD REPLY
0
Entering edit mode

When you say

it seems that there is a filtering for a limited number of genes so that if I put n=100 else n=1000,

Is this happening at top10 already, or in the plot?

ADD REPLY
0
Entering edit mode

It's in the the plot because in the top10 list I have a changing of rows number going from n=10 to 10=100 let's say.. I can share my file if that's ok for you

https://www.dropbox.com/s/x51js23lu5ho95p/All_positive_markers.CSV.zip?dl=0

ADD REPLY
0
Entering edit mode

Thank you for sharing the file. I guess you're following the Seurat tutorial here? If so, are you using their toy data or your own stuff?

ADD REPLY
0
Entering edit mode

yes, I'm using Seurat and this are my own data , thanks to you

ADD REPLY
0
Entering edit mode

Since I don't know what your input data (and therefore Seurat object) look like I can't really comment on what is happening with your data specifically. I ran the Seurat tutorial's code with their data, and it works fine. I took the top 200 genes, and the heatmap was plotted just fine (understandably very densely, of course); also worked fine with just the top 2 genes. So, I'd cautiously opine that, probably, it's not the code in of itself that is at fault.

What does DoHeatmap() do when you run it with say top10 containing the data for n = 200? Does it throw up a warning like this:

Warning message:
In DoHeatmap(pbmc, features = top10$gene) :
  The following features were omitted as they were not found in the scale.data slot for the RNA assay: HLA.DQA1, VSIR, HLA.DMB, HLA.DRB1, PECAM1, JAML, SHTN1, ADA2, GATA1, DEPDC1, JPT2, MNS1, SDHAF3, DNAJC6, SLC16A9, ATP7B, ATP5F1A, AC084033.3, PCLAF, PVT1, LCA5, GAL, APOC1, CXADR, HIKESHI, AL021155.2, CDC42BPA, TTK, EPCAM, KLF1, DTL, HJURP, ARHGAP23, SLC25A21, XK, DLGAP5, FHL2, PKLR, GYPE, KEL, ATP5IF1, ATP1B2, SPTA1, RHCE, SOX6, ALAS2, TMEM56, HBB, CA1, CTSE, SLC4A1, HBD, RHAG, HBA2, HBM, AHSP, GYPB, GYPA, RSRP1, FYB1, TENT4B, TENT5C, TRGC1, HLA.C, LUC7L2, GRK2, EBLN3P, UHRF1, HLA.DPA1, SMIM3, HLA.DPB1, HLA.DRA, MME, CYGB, CD24, IGHM, JCHAIN, DNTT, HLA.DQB1, TENT5A, CARD19, HLA.DRB5, ERO1A, ATP2B1.AS1, AC245128.3, CXCL8, RIPOR2, HLA.F, XIST, HLA.E, HLA.B, TRBC2, MT.ND2, HLA.A

This is what I got when I tried to plot your data with the tutorial's Seurat object.

ADD REPLY
0
Entering edit mode

yes, I have this message Do you think there is something wrong in my list?

ADD REPLY
0
Entering edit mode

Does that particular gene you mentioned you're interested in show up somewhere in this list? I can't really tell if there's something wrong with your list per se; it seems to have the right number of columns and attributes (it's a data.frame).

Hmm, can you also tell me how many columns your pbmc.markers data.frame has? Is it 7 or 8?

It could be that something went wrong with the processing steps prior? I think we could sit and debug this together, but we'd need some time.

ADD REPLY
0
Entering edit mode

The gene of interest is not in the output warning list, pbmc.marker yes it's a data.frame with 7 columns with the header and the numeric row.name on the left side.

I appreciate your help

thanks

ADD REPLY
0
Entering edit mode

Can you confirm that the row.names of pbmc.marker are numeric? The row.names should be the gene names. Like so: enter image description here

ADD REPLY
0
Entering edit mode

no it's not like that, I have a only one gene name list on the right like your pic, and the first column on the left is numeric

ADD REPLY
0
Entering edit mode

Could you please post the results of head(pbmc.markers) (or a screenshot like I did). Basically if your data looks like this (or has the p_val column as the first column): enter image description here

Then it probably needs to be fixed. But I'm not quite convinced this is the source of the problem. But probably worth fixing, and bringing in line with the tutorial's code anyway.

ADD REPLY
0
Entering edit mode

I run all the code again and it's fixed

https://ibb.co/XVF5Xp5

ADD REPLY
0
Entering edit mode

Nice!! Did that change the outcome of the plotting now?

ADD REPLY
0
Entering edit mode

no the heatmap has still the same problem :(

When I run this code

top10 <- pbmc.markers %>% group_by(cluster) %>% slice_max(n = 300, order_by = avg_logFC)
top10

my gene is there then I think that the problem is in the plotting step

ADD REPLY
0
Entering edit mode

What happens when you try and plot the data now? Does it throw an error, or does it plot something?

ADD REPLY
0
Entering edit mode

I have a plot but my gene is excluded from it and the error message in the console is the following:

DoHeatmap(seuratobject, features = top10$gene) + NoLegend()

Warning message:
In DoHeatmap(seuratobject, features = top10$gene) :
  The following features were omitted as they were not found in the scale.data slot for the SCT assay: CLIP1, MIDN, AKIRIN2, LASP1, R3HDM2, LAPTM4A, TMEM9B, ACTB, NCOA4, TAOK1, SKAP2, SNAP23, LACTB, PTGS2, KLF6, PAK1, ZMIZ1, CAPN2, TM9SF2, NINJ1, GPR65, OGFRL1, CAPZA2, CAST, GPSM3, AZI2, CHMP1B, CHP1, TMEM167A, ARPC4, ZDHHC7, UBL3, RNASET2, ITGA4, MID1IP1, METTL7A, IL10RA, FGR, CSF2RB, CMTM3, RCBTB2, ATP6AP2, CCPG1, RASSF5, SERP1, ZNF106, CSTB, GLIPR2, SH3BGRL, COQ10B, NR4A2, RNF149, CAP1, AGTPBP1, OAZ1, STK24, NUMB, FKBP1A, HACD4, DPH3, PEA15, DNAJC13, CCNY, TIPARP, ITM2B, IFNAR1, CMTM6, GIT2, RALB, ADAM17, MARCH1, CORO1C, TET3, ARPC5, TNFSF10, FOSB, EIF4E2, SIRPA, RAB10, WARS, HSD17B11, S100A12, SH2B3, RNF13, STAT6, VAMP3, BST1, SULF2, GCH1, MYO1F, ARPC1B, REEP5, CD68, GNS, MCTP1, LTBR, HCLS1, RTN3, SCPEP1, SAMHD1, TPP1, IL6R, VSIR, C19orf38, CTSZ, CSF3R, AGO4, RNF130, RASGEF1B, ADRB2, CRTAP, LIPA, C9orf72, IRS2, GLUD1, PLXNC1, EPB41L3, RGS19, HLA.DMB, DPYSL2, LILRA5, PPT1, DPYD, JAML, [... truncated]

ADD REPLY
0
Entering edit mode

I think something's going on with the scale.data slot. This showed up in the other comments thread we're pursuing too.

Hmm, IMHO, there's probably something that's gone wrong in one of the steps prior.

I'm not able to pinpoint a source for the error without looking at your script, and how it's handling your data, as I am not super familiar with Seurat. I searched for this specific error message, and I came across this GitHub issue. Did you try the solution mentioned there? Or more specifically, this thread on GitHub.

If you're interested and would like the assistance, we could discuss over Zoom/Skype, and figure this out together.

ADD REPLY
0
Entering edit mode

ADD REPLY
0
Entering edit mode

let me know if you have problem to find me on Skype, meanwhile I looked at the GitHub and the slot used is scale.data ,I wonder why the genes are not there

ADD REPLY
0
Entering edit mode

Also perhaps just to verify, did you try plotting your cluster 5 alone to see what that yields you? It's a bit hard to tell what's going on without some sample data and a look at your code.

ADD REPLY
0
Entering edit mode

using only the cluster 5, I can see the top10 list, but I can not plot it... my computer crashes :/

ADD REPLY
0
Entering edit mode

Does it crash with a particular error? I tried plotting only cluster 5 with the tutorial's dataset, and it works.

ADD REPLY
0
Entering edit mode

doesn't completely crashes but the fan speeds up and takes forever to get the result

ADD REPLY
0
Entering edit mode

But it does generate a result, yeah?

ADD REPLY
0
Entering edit mode

the top10 yes, gives me a list of gene, I stopped the heatmap to run because I was concerned since the fan was working a lot

ADD REPLY
0
Entering edit mode

That's just weird. Could you try plotting with something small like

top10 <- pbmc.markers %>% filter(cluster == 5) %>% top_n(n = 4, wt = avg_logFC)
DoHeatmap(pbmc, features = top10$gene) + NoLegend()
ADD REPLY
0
Entering edit mode

here is the result, there is an error

  top10 <- pbmc.markers %>% filter(cluster == 5) %>% top_n(n = 4, wt = avg_logFC)
    > DoHeatmap(seuratobject, features = top10$gene) + NoLegend()
    Error in DoHeatmap(seuratobject, features = top10$gene) : 
      No requested features found in the scale.data slot for the SCT assay.

what I tried before was go imported the a .csv file with the only cluster 5 result , here I have a error instead

ADD REPLY
0
Entering edit mode

That sounds like a problem with you seuratobject object. Looks a pre-processing step has been missed/omitted/gone wrong? Take a look at this GitHub issue.

ADD REPLY

Login before adding your answer.

Traffic: 1965 users visited in the last hour
Help About
FAQ
Access RSS
API
Stats

Use of this site constitutes acceptance of our User Agreement and Privacy Policy.

Powered by the version 2.3.6