Normalize FPKM values for cross-sample comparisons?
1
0
Entering edit mode
3.5 years ago

Hi there,

I want to use the SCANB-Datasets (https://www.ncbi.nlm.nih.gov/geo/query/acc.cgi?acc=GSE81540) for classifying samples into PAM50 breast cancer subtypes. However, the dataset is only available as FPKM-log2-transformed data (only the very original expression data is also available, but I would like to avoid all these additional preprocessing steps they already carried out).

FPKM is not suitable for cross-sample comparisons. What normalization can I put on top of the data to achieve cross-sample comparability? I guess I need to re-log2-transform the data first to then apply another normalization strategy?

Is this a valid strategy at all? Should I try to back-transform the FPKM values to the original counts to start a fresh normalization?

I appreciate your help with this!

Best, Cindy

FPKM RNA-Seq Normalization • 2.5k views
ADD COMMENT
1
Entering edit mode

Kevin, thanks a lot for your helpful input!

I had thought of the same regarding FPKM-UQ, but when researching about the TCGA method, it looked as if the upper quartile normalisation was carried out during the FPKM normalisation (see here: https://docs.gdc.cancer.gov/Encyclopedia/pages/HTSeq-FPKM-UQ/):

FPKM = [RMg * 109 ] / [RM75 * L]

RMg: The number of reads mapped to the gene

RM75: The number of read mapped to the 75th percentile gene in the alignment.

L: The length of the gene in base pairs

Besides that, I had not found any other resource stating that it is ok to carry out upper quartile normalization on top of FPKM (so I was a bit unsure about that).

Otherwise, transform the FPKMs via zFPKM to become Z-scores, which are then amenable for almost all downstream analyses. This looks good - I think I will give it a try. Do you have some kind of resource that recommends that for preprocessing (or some kind of literature where you have seen people doing that)?

Best

Cindy

ADD REPLY
0
Entering edit mode

Why not just convert FPKMs to TPMs?

ADD REPLY
0
Entering edit mode

No, raw counts are not available (that's exactly my problem). There is a file called "GSE81538_gene_expression_405_transformed.csv" but it does not look like raw counts to me, so I have no idea at what point in the analysis this file was generated.

According to the study, that is how they preprocessed the data:

"Base-calling using manufacturer's on-instrument software. Demultiplexing using the Picard ExtractIlluminaBarcodes algorithm. Filtering to remove reads that align (using Bowtie 2 with default parameters except -k 1 --phred33 --local) to ribosomal RNA/DNA (GenBank loci NR_023363.1, NR_003285.2, NR_003286.2, NR_003287.2, X12811.1, U13369.1), phiX174 Illumina control (NC_001422.1), and sequences contained in the UCSC hg19 RepeatMasker track (downloaded March 14, 2011).
Gene expression data in FPKM were generated using cufflinks 2.1.1 and pre-processed by collapsing on 27,979 unique gene symbols (sum of FPKM values of each matching transcript), keeping 18,802 NCBI RefSeq NM-category (mRNA) gene symbols and adding to each expression measurement 0.1 FPKM, performing a log2 transformation."

Here is an excerpt from GSE81538_gene_expression_405_transformed.csv:

...,"T389","T390","T391","T392","T393","T394","T395","T396","T397","T398","T399","T400","T401","T402","T403","T404","T405"
"uc001aaa.3",0,0,0,0,0,0,0,0,0,0.599426,0,0,0,0,0,0,0,0,0,0,0,0,0,5.19661e-05,0,0,0.0343333,0,0,0,0,0,0,0,0,0,0,0,0,0,0,0,0,0,0,0,0,0,0,0,0,0,0,0,0.0281344,0,0,0,0.149826,0,0,1.86348e-07,0,0,0,0,0,0,0,0.0124,0,0,0,0,0,1.18213e-20,0,0,0,0,0,0,0,0,0,0,0,0,0,0,0,0,0,0,0,0,0,0,0,0,0,0,0,0,...

Best,

Cindy

ADD REPLY
1
Entering edit mode
3.4 years ago

You could try to apply an extra 'upper quartile' normalisation on top of these (FPKM-UQ), which is what the TCGA consortium did when they realised the fault(s) with having produced all of their data as FPKM expression units.

Otherwise, transform the FPKMs via zFPKM to become Z-scores, which are then amenable for almost all downstream analyses.

Kevin

ADD COMMENT
0
Entering edit mode

Hi Kevin, I think a have to ask again. I tried out zFPKM on my data, but when looking at the distributions I am afraid it does not have the quality I was expecting. This is how I retransformed the data: I retransformed the log2-transformed expression values and removed 0.1 from each expression (excerpt from the original study: "...adding to each expression measurement 0.1 FPKM, performing a log2 transformation."). I then applied zFPKM and filtered genes with an absolute zScore > 3 in more than 70% of the samples.

#retransform to zFPKM scores
  exp.fpkm <- 2^expr
  exp.fpkm.original <- exp.fpkm - 0.1
  exp.zfpkm <- zFPKM(exp.fpkm.original)

  #filter out lowly expressed genes
  thres <- (ncol(exp.zfpkm) * 30) / 100
  #filter all expression values that have absolute zfpkm score above 3.0 in more than 70% of the samples
  expr.zfpkm.filtered <- exp.zfpkm[(rowSums(abs(exp.zfpkm) > 3.0)) > thres, ]

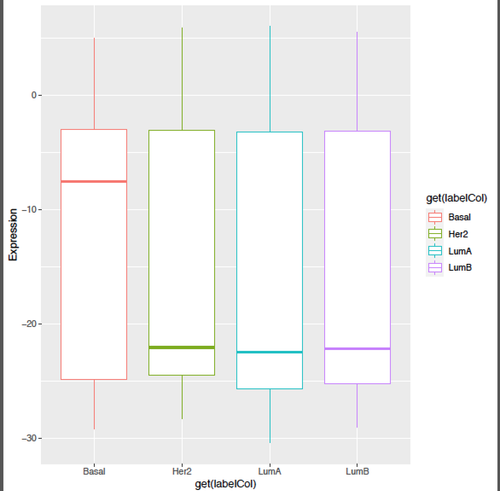
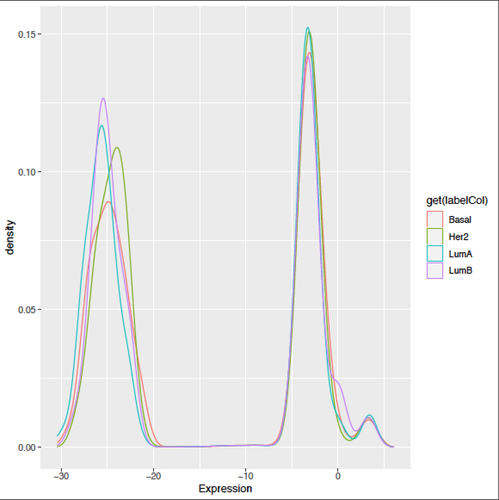
As a result quite many of the genes are filtered out, leaving me with roughly 4.5k genes (I would think this is too few). Having a look at the distributions, I am also somewhat sceptical that the data has the right quality: FKAmbV.md.png

This is how the densities look like after filtering: FKRnzN.md.png

ADD REPLY
0
Entering edit mode

Not sure what is happening but your filter for lowly expressed genes may be too harsh (?), resulting in this strange bimodal density plot. If all else fails, you could just use the log2 (FPKM+0.1) data provided by the authors. It's not entirely a waste and there would only be false-positives for those genes that are already on the fringe of statistical significance.

Irrespective, I would expect the basal samples to have different expression patterns, as these are triple-negative, if my knowledge serves me correctly.

ADD REPLY
0
Entering edit mode

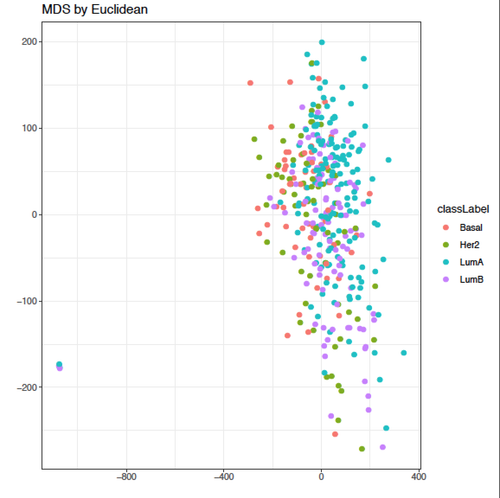
All right, I will try to set down the 70% threshold and see if it helps. Regarding the data, it seems the samples do not separate so well actually (MDS plot with Euclidean distance) as we know it from TCGA-BRCA data: FK5rP9.md.png

ADD REPLY

Login before adding your answer.

Traffic: 2724 users visited in the last hour
Help About
FAQ
Access RSS
API
Stats

Use of this site constitutes acceptance of our User Agreement and Privacy Policy.

Powered by the version 2.3.6