How to create a sequence alignment graph?
2
1
Entering edit mode
3.3 years ago

Hello, I am trying to make a figure like in this image. I have used Geneious but the resolution is very poor and not suitable for publication. I also tried Bio3d R-package. But could not get the desired output. Can anybody suggest how can I obtain such a figure? I could not find the proper function in bio3d package to get such a figure. Please give some suggestions. Thank you.

schematic of multiple sequence alignment

Assembly R sequence alignment • 4.1k views
ADD COMMENT
0
Entering edit mode

It's probably doable using ggmsa or by writing something based off of ggplot2 from scratch, but you're going to have to tell us what--for instance--the black bars and the white bars in your alignment figure are.

ADD REPLY
0
Entering edit mode

So basically, the white bars indicate gaps in the alignment. The black bars are single nucleotide polymorphisms. I checked with the authors of that paper and they told they used a script that they wrote for this graph but they lost the script. They also did not mention which software they used. That is why I am really confused.

ADD REPLY
5
Entering edit mode
3.3 years ago
Dunois ★ 2.5k

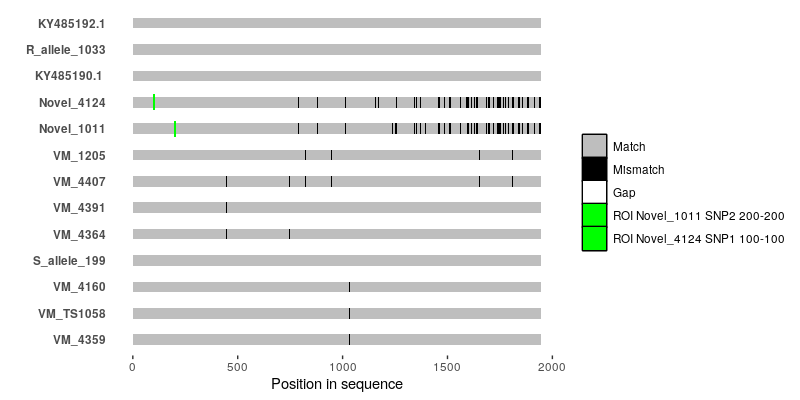
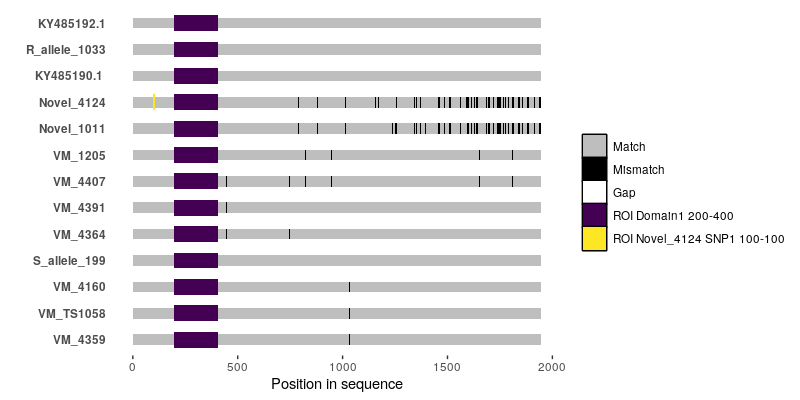
Edit: the information in this answer has been supplemented (and superseded) by what I have described in this comment in the comments section below..

So I managed to write something in R that approximates this particular alignment plot from the OP given a MSA as an input.

The function (christened msavis()) can be found at my GitHub repo here. Refer to the in-function documentation + comments for details.

But in brief, align your sequences beforehand with your favorite alignment tool (e.g., Mafft or Clustal Omega), and save it as a fasta file. Then invoke msavis() by providing it the path to this fasta file along with the name of a "reference" sequence (can be any one of the sequences in the MSA; e.g., Ref0 in the example below), and an indication of whether the reference sequence should be placed at the top (refontop = TRUE) or at the bottom (refontop = FALSE).

So if you were to test this function with the following toy MSA:

>Ref0
TTGCTACACAACAGCAACAGTCACAGACATTGTCAGTAAC---GCAGCAGCAGCAGCAGCAGAGCTCCCAGG
AGCAGCAGCTCACTTCAGTTCAGCAACCATCTCAGGCTCAGCTGACCCAGCCACCGCAACAATTTTTACAGA
CTTCTAGGTTGCTCCATGGGAATCCCTCAACTCAACTCATTCTCTCTGCTGCATTTCCTCTACAACAGAGCA
CCTTCCCTCAGTCACATCACCAGCAACATCAGTCT
>Seq1
TTGCTACACAACAGCAACAGTCACAGACATTGTCAGTAAC---TCAGCAGCGGCAGCAGCAGAGCTCCCAGG
AGCAGCAGCTCACTTCAGTTCAGCAACCATCTCAGGCTCAGCTGACCCAGCCACCGCAACAATTTTTACAGA
CTTCTAGGTTGCTCCATGGGAATCCCTCAACTCAACTCATTCTCTCTGCTGCATTTCCTCTACAACAGAGCA
CCTTCCCTCAGTCACATCACCAGCAACATCAGTCT
>Seq2
TTGCTACACAACAG---CAGTCACAGACATTGTCAGTCACACAGCAGCAGCAGCAGCAGCAGAGTGGCCAGG
AACAGCAGCTTGCTTCAGTTCAGCAACCGTCTCAGGCTCAGCTGACCCAACCACCACAGCAGTTTTTACAGA
CTTCTAGGTTGCTCCATGGGAATCCTTCAACTCAGCTTATCCTCTCTGCTGCATTTCCACTACAACAGAGCA
CTTTCCCTCAATCACATCACCAGCAGCACCAGTCT
>Seq3
TTGCTCCACAACAACCGCAGTCGCAGACACTGTCAGTCAC---------GCAGCAGCAGCAGAGTTCCCAGG
AACAGCCGCTCCCTTCAGTTCAGCAACCATCTCAGGCTCAGCTGACTCAACCACCGCAGCAGTTTCTACAGA
CTTCTAGGTTGCTCCATGGGAACCCTTCAACTCAGCTTATCCTCTCTGCTGCATTTCCTCTACAGCAGAGCA
CTTTCCCTCAGTCACATCACCAGCAACACCAGTCG
>Seq4
TTGCTCCACAACAACCGCAGTCACAGACACTGTCAGTCAC---------GCAGCAGCAGCAGAGTTCCCAGG
AACAGCCTCTCCCTTCAGTTCAGCAACCATCTCAGGCTCAGCTGACTCAACCACCGCAGCAGTTTTTACAGA
CTTCCAGGTTGCTCCATGGGAACCCTTCAACTCAGCTTATCCTCTCTGCTGCATTTCCTCTACAGCAGAGCA
CTTTCCCTCAGTCACATCACCAGCAACACCAGTCG
>Seq5
TTGCCACACAACAGCAACAGCAGCAGCAACAGCAGCAGCA---GCAGCAGCAACAGCAGCAGAGCTCCCAAG
AGCAGCAGCTTCCTGCAGTTCAGCAACCATCTCAGGCCCAGCTGACCCAGCCACCACAGCAGTTTTTACAGA
CACCTAGGTTGCTCCATGGGAATCCTTCCGCTCAGCTCATCCTCTCTGCTGCCTTTCCTCTACAACAGAGCA
CCTTCCCTCCGTCGCATCACCAGCAACACCAGCCT
>Seq6
TTGCCACACAACAGCAACAGCAGCAGCAACAGCAGCAGCA---GCAGCAGCAACAGCAGCAGAGCTCCCAAG
AGCAGCAGCTTCCTGCAGTTCAGCAACCATCTCAGGCCCAGCTGACCCAGCCACCACAGCAGTTTTTACAGA
CACCTAGGTTGCTCCATGGGAATCCTTCCGCTCAGCTCATCCTCTCTGCTGCCTTTCCTCTACAACAGAGCA
CCTTTCCTCCGTCGCATCACCAGCAACACCAGCCT

By invoking msavis() like so:

msavis("/path/to/test/alignment.fasta", "Ref0", refontop = TRUE)

You'd get the following plot: msavisinaction

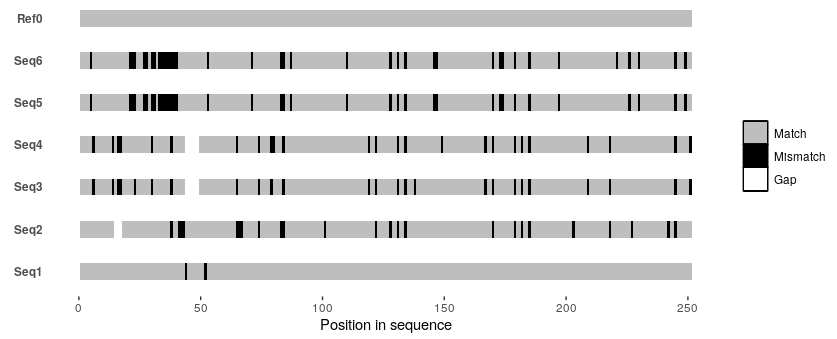
There's probably a lot of additional functionality that can be added to this function, but this is a start. I'm plenty sure there are a couple of bugs in there, so I'd appreciate any and all feedback.

ADD COMMENT
0
Entering edit mode

Thank you very much for your work. I will definitely try it and see.

ADD REPLY
0
Entering edit mode

Yes, it has worked beautifully. Many many thanks for writing down the function. Very much appreciated!

ADD REPLY
0
Entering edit mode

You're welcome!! Glad to have been able to help. If this'll be used in a publication, please cite the GitHub repo.

ADD REPLY
0
Entering edit mode

Just a comment: I have a few cases where I have a single mismatch between two sequences. In such cases, the black bar is not quite visible. I have to save the figure in a wider margin to be able to see that mismatch bar. Is it possible to make the mismatch bars bolder?

ADD REPLY
0
Entering edit mode

Could you perhaps give me an example dataset so that I can take a look myself? I presume these are very long sequences then?

Off the top of my head, there are two ways I can think of making such a feature stand out:

  • Option 1: Subset the alignment region of interest, and plot only this portion using msavis, and then mess around in some presentation tool to visualize the region of interest's plot as a zoomed-in/blown-up inset (e.g., like in this post.). This is probably the way to go if it's just for a single (set of) plot(s). There is probably also a way to do this natively in R but I'd have to look into it (so you'd have to tell me if it's necessary).
  • Option 2: Tweak msavis to highlight additional geom_tiles in the vicinity of a feature in situations such as the one you describe: this would then simulate a "thicker" bar for a particular feature of interest. The downside I can see is that this would probably make plots inconsistent since this type of highlighting would be strictly conditional: a bar of width n in one plot need not be equivalent to a bar of width n in another. As such, it could lead to your plots/figures being misinterpreted.

I'll follow up on this depending on your feedback.

ADD REPLY
0
Entering edit mode

Yes, the sequence is 1944 bp long. The problem is, I have SNP in multiple positions so if I need to zoom in then I would have to do it multiple times in the same figure, which is not what I want in a publication. And the figure is going to be included in a manuscript (I will surely cite your GitHub repo). Below I have attached a subset of my data. Please have a look.

Here is the link to the example data: [https://www.dropbox.com/s/gqqbvlbs7w7xj6i/google.fasta?dl=0]

ADD REPLY
0
Entering edit mode

I apologize for the late follow up here. It's a busy week (hence also my rather terse response that follows).

I've overhauled the function to incorporate additional flexibility that I think can potentially address your problem. Very briefly, say now you have multiple SNPs (say at position 100 on sequence1 and another SNP at position 200 at sequence2), you can supply these to (the now renamed) seqvisr:::msavisr() function and plot them with their own colors (as the so-called region-of-interest/ROI geom_tile layer). In addition, the widths and heights of the feature "bars" can be adjusted by the user: this should be especially useful in forcing features (especially mismatches and gaps) that might not be visible otherwise.

I've illustrated this briefly with the MSA you linked me here below:

library(seqvisr)

#Input MSA file
inpmsa <- "/path/to/fastafile.fasta"

#Two different SNPs that need to be visualized in addition to all mismatches and gaps
multfeatures <- list(c("Novel_1011", 200, "SNP2"), c("Novel_4124", 100, "SNP1"))

msavisr(mymsa = inpmsa, myref = "KY485192.1", wnon = 2.0, myroi = multfeatures, wroi = 8.0, hroi = 0.6, cbfcols = TRUE, basecolors = c("Gray", "Black", "White"), roicolors = c("Green", "Green"))

multiplesnps

You can basically pass as many features as you want as ROIs, so you can end up visualizing stuff like domains and whatnot, like below:

msadomains

I've documented what msavisr can do within the function itself (?msavisr after installation). I think if you read through the documentation and try out a couple of things--and I presume with some additional discussion here--you'll be able to arrive at a working solution.

Here's the link to the GitHub repo. I presume you'll probably run into problems running the code (I only had so much time to debug the code), so please let me know how this goes.

ADD REPLY
0
Entering edit mode

Hello, thank you for your elaborate answer. Yes, it worked perfectly. I did not have any problems while running the code or manipulating the graphic features. I highly appreciate all your efforts into this. Thank you very much. For now, the ROI options is not necessary at all for my paper. But in the future, it will be a great addition. I will share the GitHub repo with my colleagues who need such kind of analysis. Of course, it will be properly cited. Thank you very much.

ADD REPLY
0
Entering edit mode

Glad to hear it worked without any major hitches!! I wish you the very best for your research and publication(s)!!

ADD REPLY
0
Entering edit mode

anikcropscience : Please accept the answer (green check mark) to provide closure to this thread.

ADD REPLY
0
Entering edit mode

Ah sorry, where can I do this? I do not see any green checkmark to accept an answer. Sorry to be naive.

ADD REPLY
0
Entering edit mode

See if this helps :
See if this helps

ADD REPLY
0
Entering edit mode

Okay, thank you. I will do that. Just waiting for the last reply.

ADD REPLY
2
Entering edit mode
3.3 years ago
evolozzy ▴ 140

You can use geom_tile in R by assigning values to Reference and Alternate alleles (0 and 1 would work) Then plot it position on x axis and the alignment on Y axis. The rest is aesthetic settings.

ADD COMMENT
0
Entering edit mode

Will it work with Fasta sequence file? because I have the alignment in Fasta format.

ADD REPLY
0
Entering edit mode

If the gaps are aligned too, (which means all your alignments have the same length) it would work.

ADD REPLY

Login before adding your answer.

Traffic: 2025 users visited in the last hour
Help About
FAQ
Access RSS
API
Stats

Use of this site constitutes acceptance of our User Agreement and Privacy Policy.

Powered by the version 2.3.6