
How to draw a funnel plot using plotly package in R.
My input data:
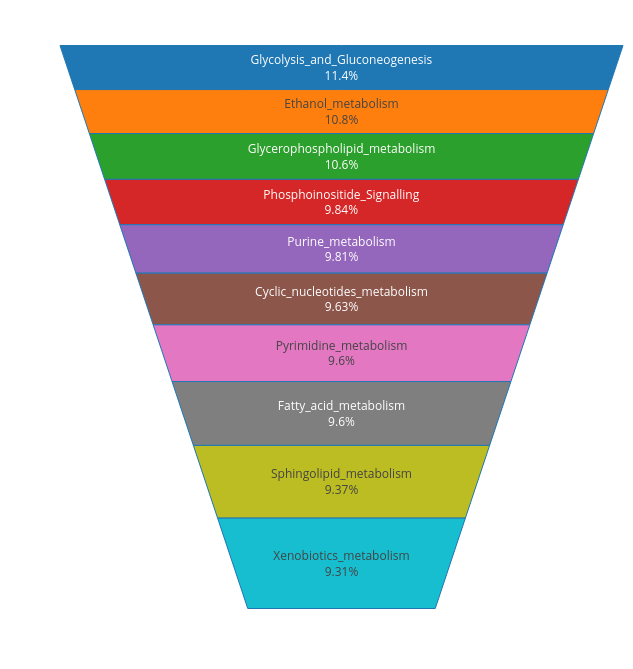
Pathways Corr
Glycolysis and Gluconeogenesis 0.455493708 Ethanol metabolism 0.429998123 Glycerophospholipid metabolism 0.421699867 Phosphoinositide Signalling 0.391815903 Purine metabolism 0.39031344 Cyclic nucleotides metabolism 0.383469071 Pyrimidine metabolism 0.382263162 Fatty acid metabolism 0.382037554 Sphingolipid metabolism 0.372782697 Xenobiotics metabolism 0.370505068
My code:
library(plotly) f <- as.data.frame(read.delim(file = "FUNNEL1.txt")) f1 <- as.data.frame(f) fig <- plot_ly(f1, type = "funnelarea") fig

Thanks sir for your valuable help.
You're welcome!!
And you don't need to address me (or other random strangers) as "sir". We're just humans too, and there is no artificial hierarchy here. You are nobody's subordinate, and nobody is your superior.
(And besides, you don't necessarily know a user's gender, or whether they subscribe to the notion of having a gender, for that matter.)