Hi. Can anyone explain concisely why there is a relationship between mean and variance in single cell data?
I keep finding papers/vignettes which say this dependency exists and how to correct for it, but nowhere actually seems to suggest why it's there in the first place.
First, have a look at what the relationship between mean and variance looks like for RNA-seq data: genes with very low read counts tend to have greater variability in their counts than genes with very high gene counts. The reason for that is that the measurement of the gene expression is inherently noisy and we never capture all available transcripts. Let's say there's a gene with exactly 5 transcripts in a given cell. If we're lucky, we might be able to catch all of them in one sample, while in another replicate, where the gene has the same number of transcripts, we may only manage to capture 1 or even 0 transcripts (I'm drastically simplifying here; there are numerous steps along the process where transcripts/read might get "lost"). So, in brief, the mean-variance relationship exists because the sample preparation and library preparation steps seem to have more trouble with reliably quantifying lowly expressed genes.
Here are two great examples from Wikipedia's entry on heteroskedasticity that have nothing to do with sequencing, but may give you a general feeling for what types of situations lend themselves to heteroskedasticity:
Heteroscedasticity often occurs when there is a large difference among the sizes of the observations.
A classic example of heteroscedasticity is that of income versus expenditure on meals. As one's income increases, the variability of food consumption will increase. A poorer person will spend a rather constant amount by always eating inexpensive food; a wealthier person may occasionally buy inexpensive food and at other times eat expensive meals. Those with higher incomes display a greater variability of food consumption.
Imagine you are watching a rocket take off nearby and measuring the distance it has traveled once each second. In the first couple of seconds your measurements may be accurate to the nearest centimeter, say. However, 5 minutes later as the rocket recedes into space, the accuracy of your measurements may only be good to 100 m, because of the increased distance, atmospheric distortion and a variety of other factors. The data you collect would exhibit heteroscedasticity.
When you say "genes with very low read counts tend to have greater variability in their counts than genes with very high gene counts" - my understanding was the opposite, that as the mean increases, the variance also increases. To me this is also what is suggested by the example of expenditure on meals, that as mean wealth increases, the variance of food spend is higher. Perhaps I am misunderstanding the difference between variability and variance? Or are you using them interchangeably?
My question arose from looking at a hbctraining module that touched on normalising in order to control for this heteroskedasticity:
You are right, this is all a bit muddled up. For example, see the explanation for the exact same figure you're highlighting:
The mean is not equal to the variance (the scatter of data points does not fall on the diagonal).
For the genes with high mean expression, the variance across replicates tends to be greater than the mean (scatter is above the red line).
For the genes with low mean expression we see quite a bit of scatter. We usually refer to this as “heteroscedasticity”. That is, for a given expression level in the low range we observe a lot of variability in the variance values.
I'll try to write a summary of the different types of definitions and characteristics different people/sources tend to refer to, but to focus on the "WHY", I would like to emphasize that the explanation for the problems of RNA-seq count data remains the fact that the quantification of transcripts is inherently noisy.
This is incredibly helpful Friederike, I have spent days googling this and your write up helped me tremendously. I couldn't figure out why log-transforming minimized the variance of highly expressed genes so severely. Now I do. It is not ideal, because it dismisses the biological importance of abundant transcripts. I also see that not transforming at all will miss important changes across lowly expressed genes since they will show small variances. Thank you very much.
wouldn't it be good to have always very low intra-condition variance to also find small changes inter-condition? Since log is applied for counts before statistics, lowering inter-condition variance for large count genes, it seems that biological difference between conditions might get lost for high count genes.
Of course it would be great to always have no noise, but that's not what biology and experiments give us.
The model learns the mean-variance trend, so lower variance in highly-expressed genes rather than more lowly-expressed genes on the log scale are no problem. This is called overdispersion. Common testing frameworks such as DESeq2 and limma take care of that.
i see.
what i meant was built on my assumption that variances in these plots are calculated over the whole row for each gene, thus over all conditions. therefore, minimizing the variance between conditions would make it harder detect differences between conditions, right?
whenever i try to understand something on these topics, i think i got it because i have "ahaa" moments, until i try to explain it. then i realize that i am still missing valuable information to fully understand what limma and co are doing. it feels like in addition to reading the papers and the forums, i would need to understand and apply the maths to fully understand what is happening.


Thanks for the response.
When you say "genes with very low read counts tend to have greater variability in their counts than genes with very high gene counts" - my understanding was the opposite, that as the mean increases, the variance also increases. To me this is also what is suggested by the example of expenditure on meals, that as mean wealth increases, the variance of food spend is higher. Perhaps I am misunderstanding the difference between variability and variance? Or are you using them interchangeably?
My question arose from looking at a hbctraining module that touched on normalising in order to control for this heteroskedasticity: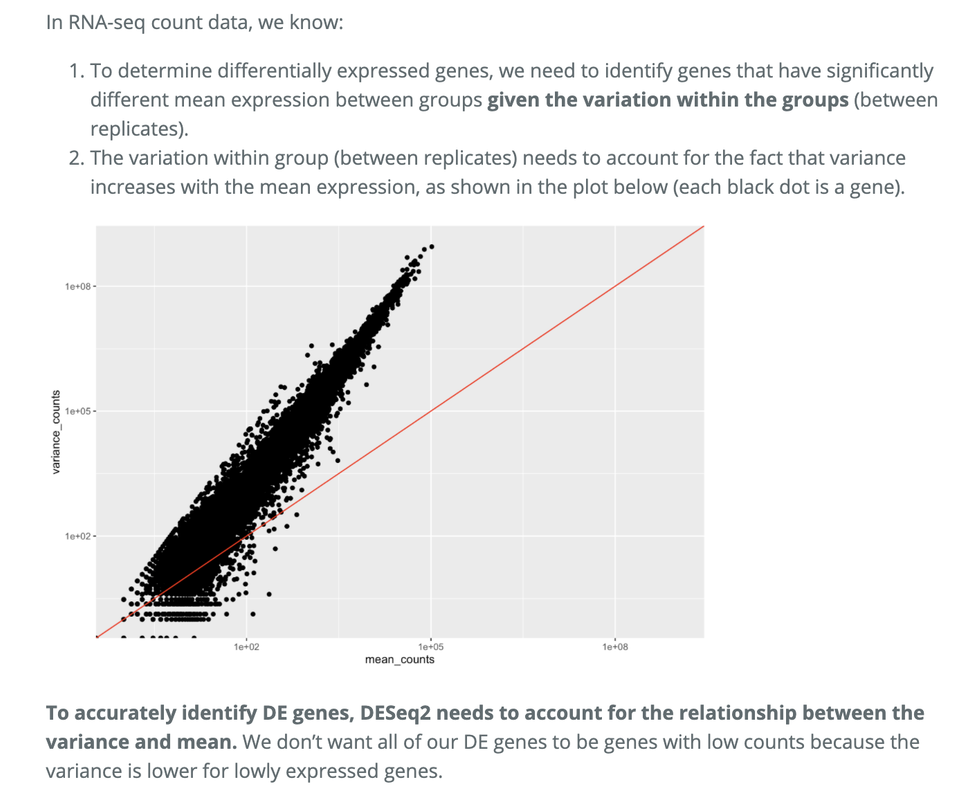
You are right, this is all a bit muddled up. For example, see the explanation for the exact same figure you're highlighting:
Source: https://hbctraining.github.io/DGE_workshop_salmon_online/lessons/01c_RNAseq_count_distribution.html
I'll try to write a summary of the different types of definitions and characteristics different people/sources tend to refer to, but to focus on the "WHY", I would like to emphasize that the explanation for the problems of RNA-seq count data remains the fact that the quantification of transcripts is inherently noisy.
Alright, so let me know if my write up helps elucidate the issue.
This is incredibly helpful Friederike, I have spent days googling this and your write up helped me tremendously. I couldn't figure out why log-transforming minimized the variance of highly expressed genes so severely. Now I do. It is not ideal, because it dismisses the biological importance of abundant transcripts. I also see that not transforming at all will miss important changes across lowly expressed genes since they will show small variances. Thank you very much.
wouldn't it be good to have always very low intra-condition variance to also find small changes inter-condition? Since log is applied for counts before statistics, lowering inter-condition variance for large count genes, it seems that biological difference between conditions might get lost for high count genes.
am i on the right track here?
Of course it would be great to always have no noise, but that's not what biology and experiments give us.
The model learns the mean-variance trend, so lower variance in highly-expressed genes rather than more lowly-expressed genes on the log scale are no problem. This is called overdispersion. Common testing frameworks such as DESeq2 and limma take care of that.
i see. what i meant was built on my assumption that variances in these plots are calculated over the whole row for each gene, thus over all conditions. therefore, minimizing the variance between conditions would make it harder detect differences between conditions, right?
whenever i try to understand something on these topics, i think i got it because i have "ahaa" moments, until i try to explain it. then i realize that i am still missing valuable information to fully understand what limma and co are doing. it feels like in addition to reading the papers and the forums, i would need to understand and apply the maths to fully understand what is happening.