
I am looking at some RNAseq PE reads (250 bp) data for de novo assembly, and ran fastp on them for quality control and diagnostics.
The insert size distribution plot looks like this:
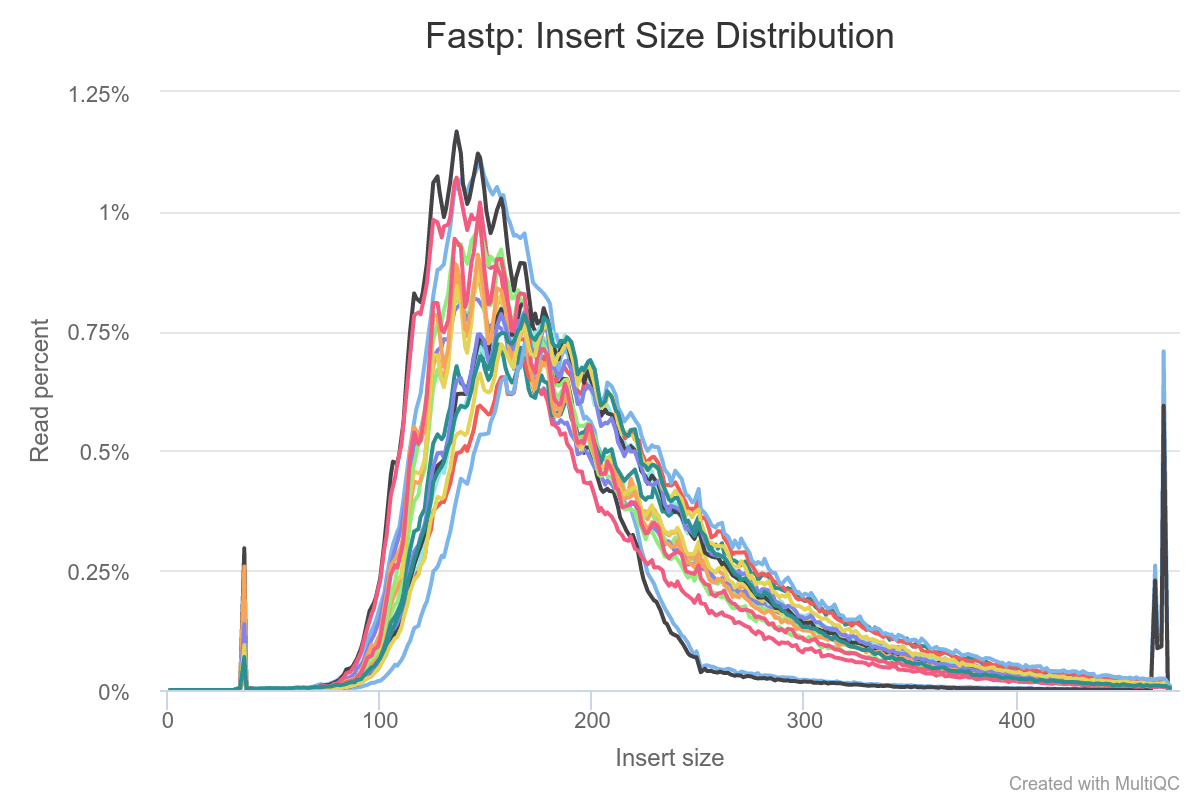
I presume the broad peak between ca. 100-300 bp would be "proper" reads. What are the additional peaks in here though? I am referring to the sharp peak(s) at ca. 30 bp (to the left of the "main" peaks) and the sort of bimodal peak to the far right around 480 bp.
Would it be safe to exclude those reads using length-based filtering criteria?
Coming to the sequence quality plot, it looks like this after running fastp (this is the plot for the second read in the read pairs):
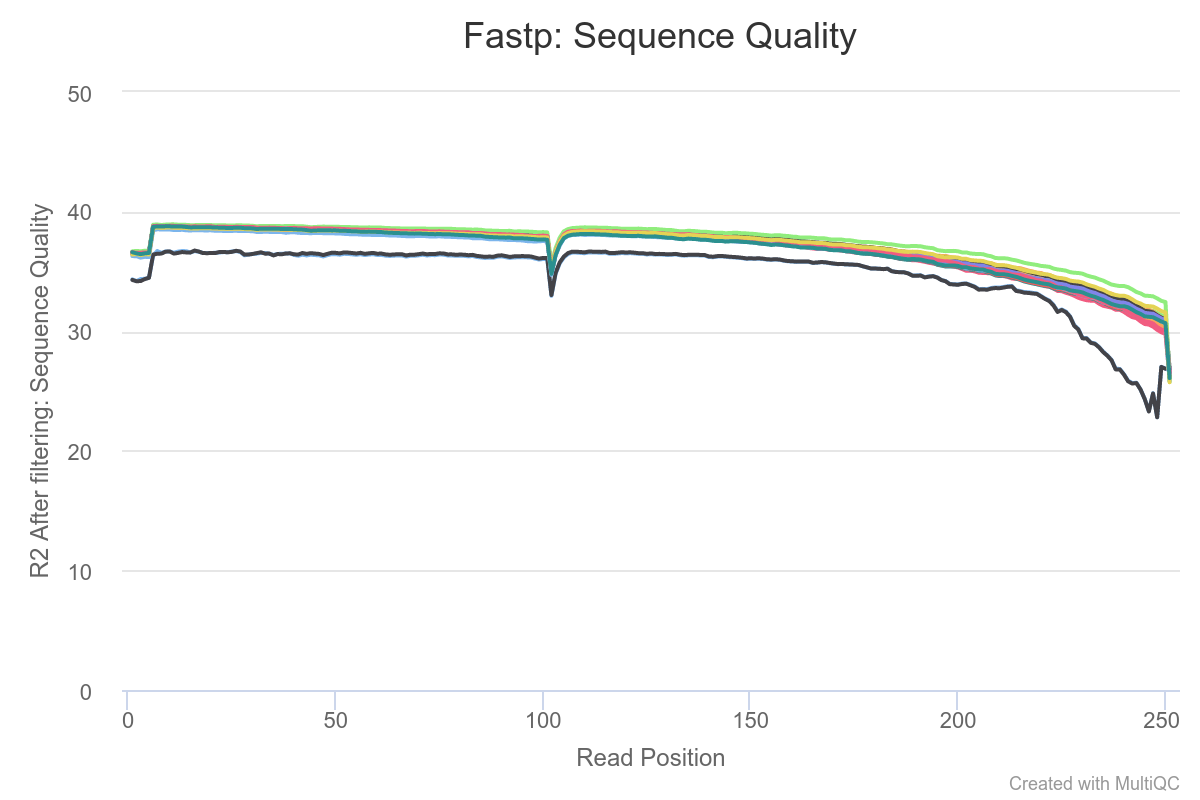
Why is there that distinct dip in quality ca. 120 bp? Is this normal, and is it an artifact of the sequencing chemistry? (The data is--I presume--pretty good otherwise.)
Has this data been trimmed or are you just plotting the original data?
This is from after calling
fastpwith--detect_adapter_for_pe --correction --overrepresentation_analysis --low_complexity_filter --trim_poly_x --trim_poly_g --average_qual=15 --overrepresentation_sampling=1. So I presume I've only trimmed for poly-Xs in the tails. I did not requestfastpto do any explicit trimming otherwise.Also, happy new year GenoMax!!
I am not a
fastpuser so I am not sure how it uses the data to determine the insert size. I assume it is doing that by read merging. I scan/trim the data to remove adapters and then look at QC. Insert sizes will follow normal distribution so your data looks fine.That could represent a sequencing anomaly (e.g. a bubble going through FC). Even after the dip the Q scores remain above Q30 so I would not immediately worry about that.
Happy New Year to you as well!