
Is it correct that every horizontal line in a heatmap (on the right) stands for a specific gene? 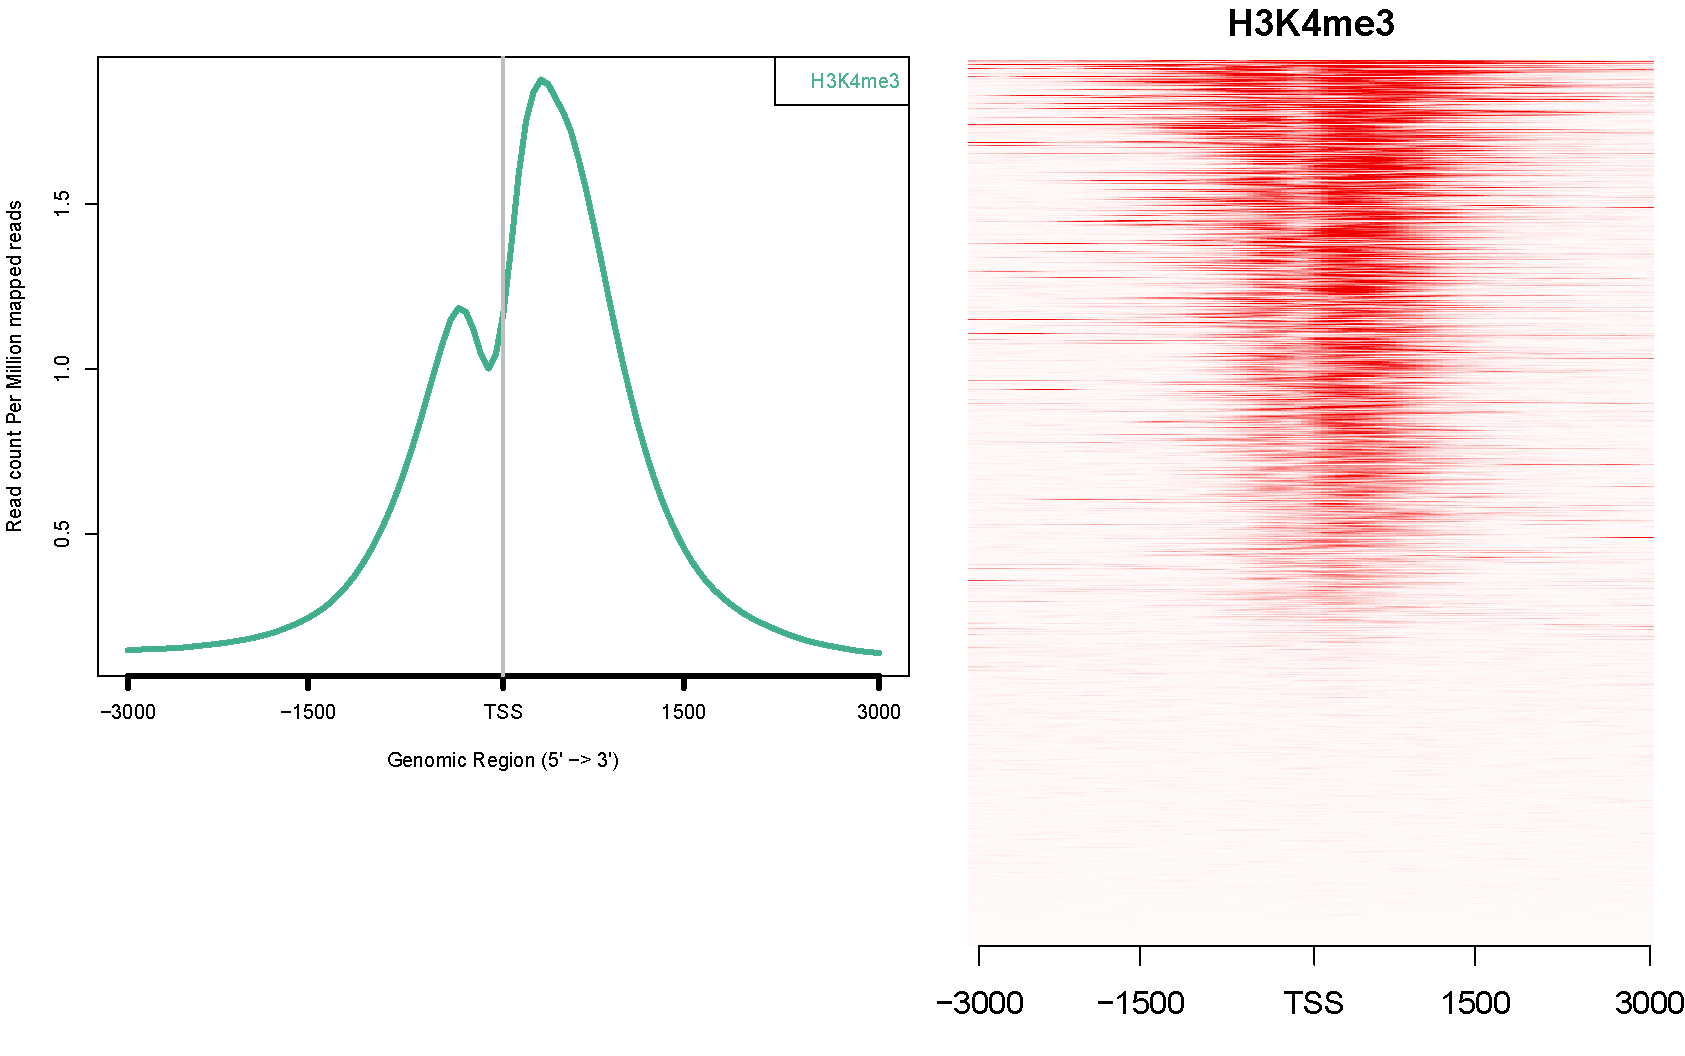
Also, are the different genes normalized by ngsplot in any way when plotting a specific distance from the TSS? I would guess that when plotting distance from TSS there is no need for normalization, but when plotting a genebody profile, then the genes are normalized. The ngsplot article article is somewhat ambiguous on the question of normalization when plotting around the TSS :
The coverage data are then subjected to two steps of normalization. In the first step, the coverage vectors are normalized to be equal length and this can be achieved through two algorithms. The default algorithm is spline fit where a cubic spline is fit through all data points and values are taken at equal intervals. The alternative algorithm is binning where the coverage vector is separated into equal intervals and the average value for each interval is calculated. This first step of length normalization allows regions of variable sizes to be equalized and is particularly useful for genebody, CGI, and custom regions.