Entering edit mode

3.1 years ago
Palgrave
▴
110
Hi,
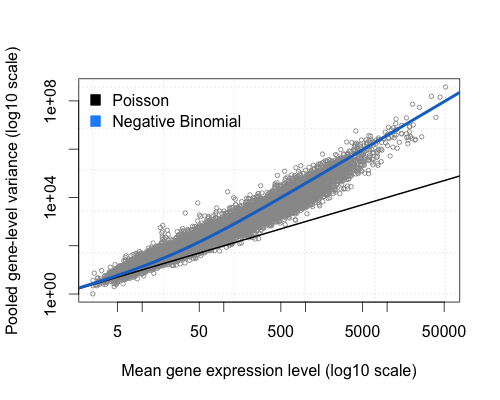
I wonder what the differences are between the two plots below and what they really show.
The first plot is supposed to show that the variance for highly expressed genes are higher than for lowly expressed genes.
The second plot however, I am not sure what it shows. I interpret that it shows that the "dispersion" is higher for lowly expressed genes than for highly expressed genes? What does this mean in relation to the first plot?