
Hello Biostars Community,
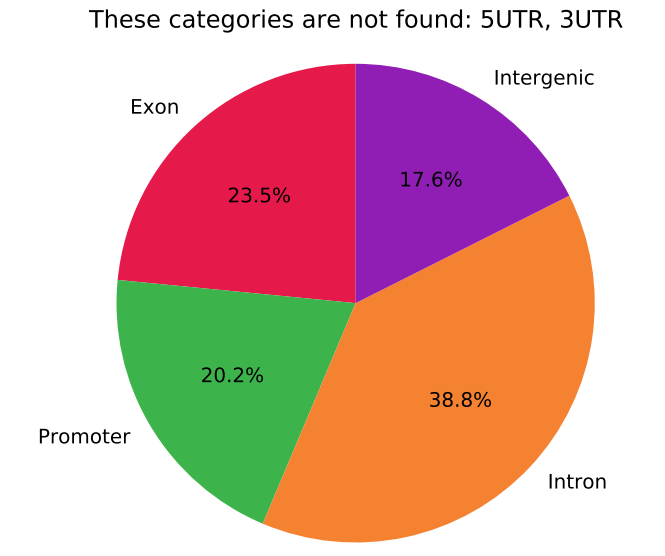
I want to make a pie chart for methylation array data similar to this:
I have beta values and probes, and also know what the probes correspond to (ie. Enhancer, TSS, GeneBody etc.)
To make this kind of plot would I basically extract all probes with beta values over .05 as methylated, and then do the same for probes with beta values below .05 and label them as unmethlayted. And then finally make a genomic features pie chart of methylated and also one for unmethylated using these extracted probes?
I learned/refreshed on beta values here: Interpretation of Beta values : Methylation data
Please let me know what you think.
Thank you in advance, Pratik
EDIT: So according to the most popular answer here: https://www.researchgate.net/post/Can-anyone-explain-how-to-calculate-methylation-level-from-bisulfite-sequencing-results
Because bisulfite sequencing has a relatively high error rate, samples between 0% and 10% are usually classified as "unmethylated", and samples between 90% and 100% are classified as "fully methylated". [But these thresholds are not fixed. Some groups use 0-5% and 95-100%, others use 0-20% and 80-100%.]
Do you agree? Is this the best way to generate a pie chart like this?


Thank you Papyrus!
I made a new question regarding combining biological replicates for a genomic feature plot here: How to plot/combine biological replicates on a genomic features plot for methylated array?