GSEA plot, clusterprofiler
1
0
Entering edit mode
2.6 years ago
szheng • 0

Hi

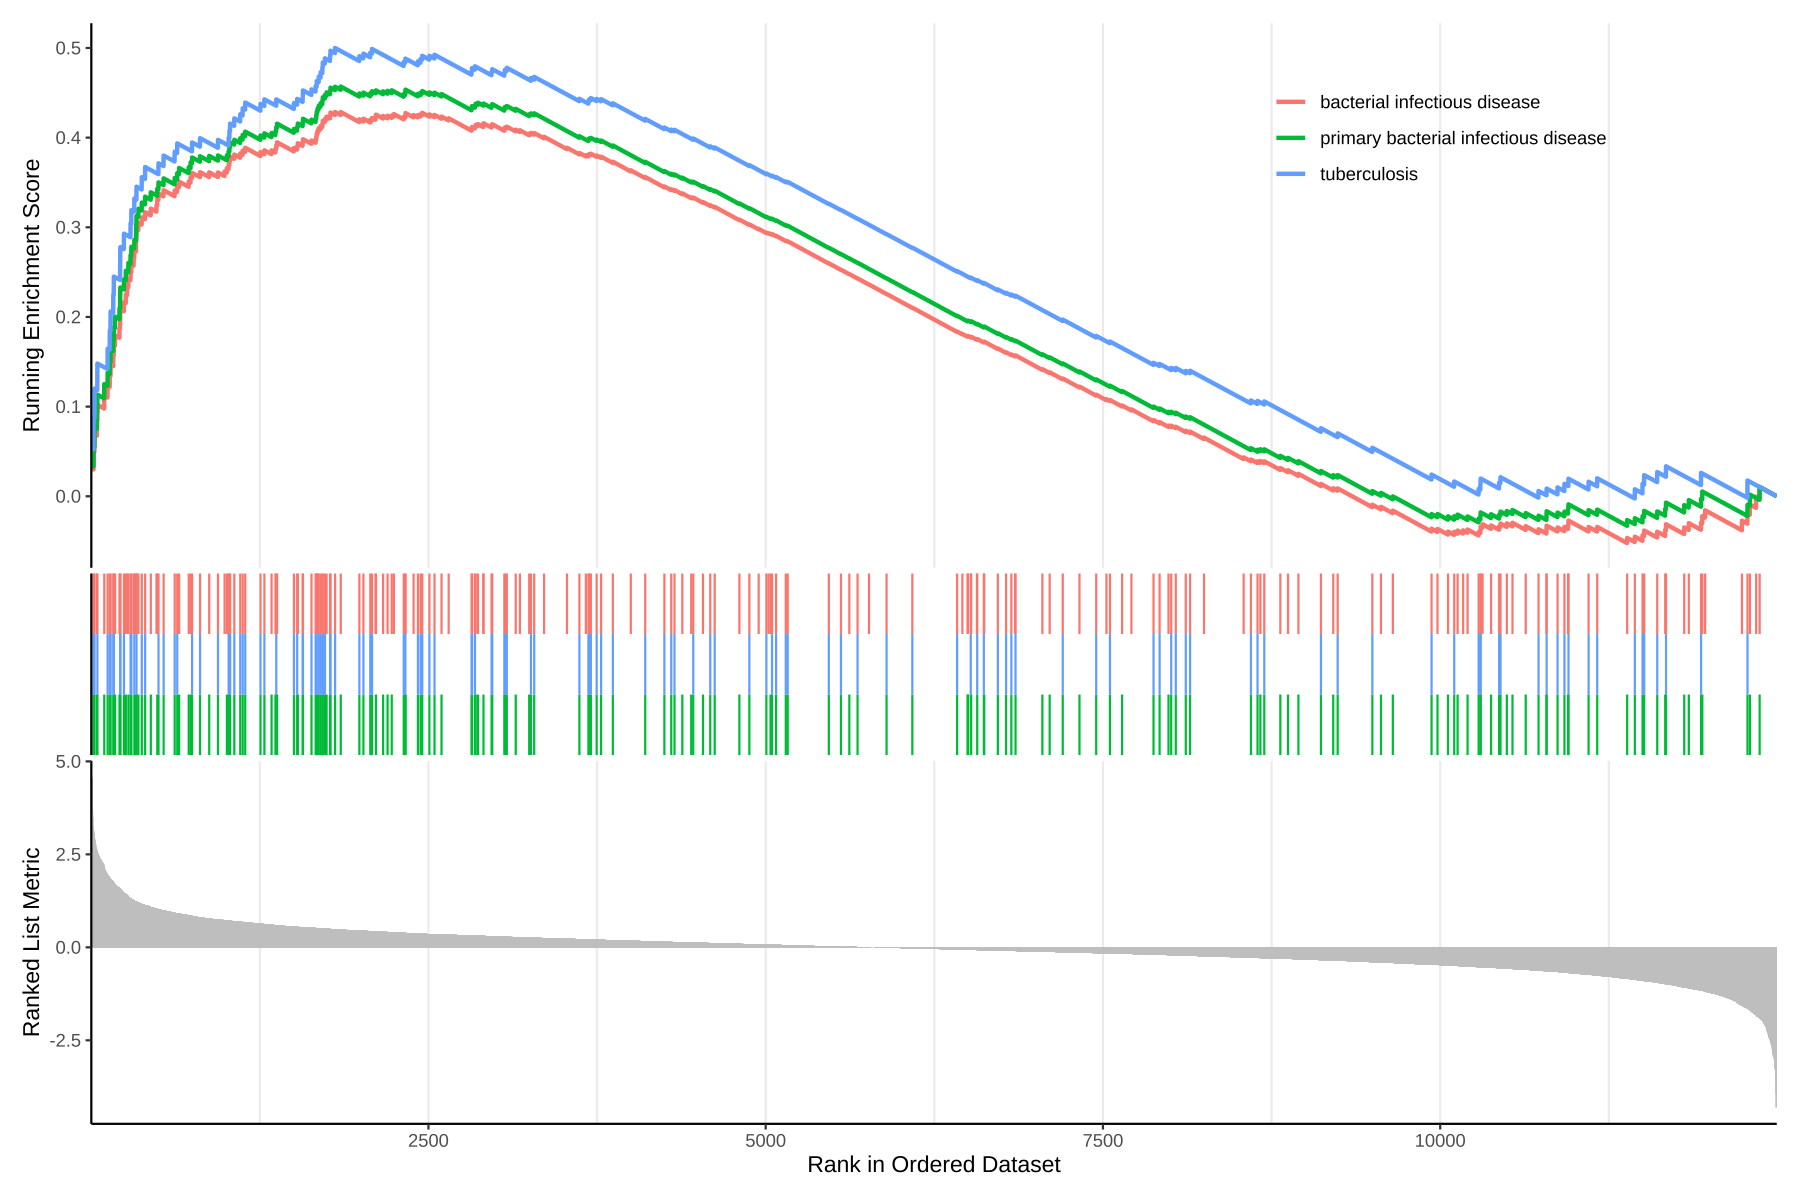
I am trying to use gseaplot2 to create a figure that contains multiple analyses, like RNAseq and chipsep, so the figure has both RNAseq pathway and CHiPseq pathway. How to do that?

https://yulab-smu.top/biomedical-knowledge-mining-book/biomedicalKnowledge_files/figure-html/gseaplot22-1.png

Thanks,

Shikan

clusterprofiler GSEA • 1.9k views
ADD COMMENT
0
Entering edit mode
2.6 years ago
h.mon 35k

The documentation associated to the figure you linked explains in detail how to do this plot. Read this page carefully:

15 Visualization of functional enrichment result

If you are in a hurry, go directly to:

15.10 running score and preranked list of GSEA result

If you are unsure how to apply this to your data, or if you run into particular problems, please be specific and explain in detail what are your difficulties.

ADD COMMENT
0
Entering edit mode

For example in the figure I provided, there are 3 pathways presented in the figure. Those pathways are from one gsea analysis. What if I want to make the similar figure but pick some pathway from multiple gsea analyses. Sorry I made this unclear.

ADD REPLY
0
Entering edit mode

Hi There!

Did you find a way to get it? I am also interested on it, if it is possible.

ADD REPLY

Login before adding your answer.

Traffic: 1540 users visited in the last hour
Help About
FAQ
Access RSS
API
Stats

Use of this site constitutes acceptance of our User Agreement and Privacy Policy.

Powered by the version 2.3.6