Entering edit mode

16 months ago
moshi
▴
150
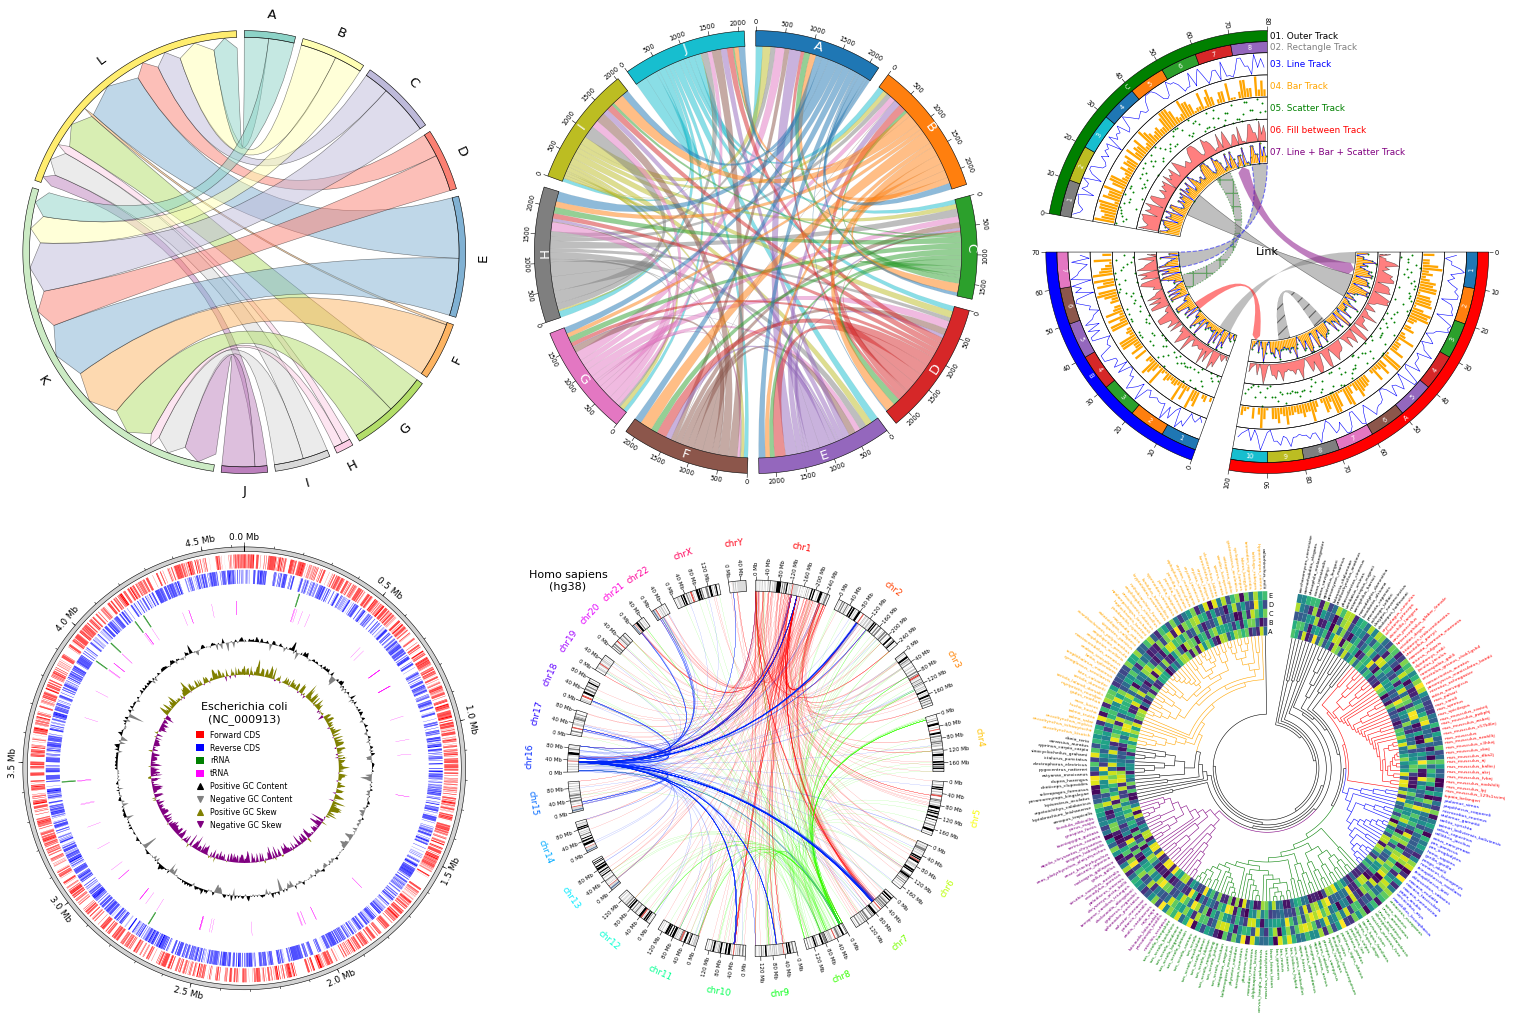
pyCirclize is a circular visualization python package implemented based on matplotlib. This package is developed for the purpose of easily and beautifully plotting circular figure such as Circos Plot and Chord Diagram in Python. In addition, useful genome and phylogenetic tree visualization methods for the bioinformatics field are also implemented. pyCirclize was inspired by circlize and pyCircos.
As an example, the following figure can be plotted.
just wanted to say, all your visualization tools are great. stumbled on them awhile ago and have added some to my awesome-genome-visualization list :) https://cmdcolin.github.io/awesome-genome-visualization/?latest=true&selected=%23pyGenomeViz will have to add this too
@cmdcolin
awesome-genome-visualization website is very helpful because it describes various visualization tools in one place. I appreciate your continual updates and maintenance as I refer to it often.
I am also glad to hear that you will consider adding pyCirclize to that list.
Hey I'm using pyCirclize and I have a suggestion. I notice that when I'm adding y ticks to my plot, there's no option to choose which 'side' of the sector they appear on. They always seem to strictly appear on the end of the sector in the clockwise directions end. Can you add a feature to allow the user to choose which end of the sector the y ticks appear on?
In the newly released pyCirclize v0.1.3, I added a
sideargument parameter to thetrack.yticks()method.This enables users to select the plot position of yticks with side="right" or side="left".
If you are interested in code examples, please refer to the following links.
https://moshi4.github.io/pyCirclize/plot_api_example/#3-7-yticks
That was fast! Thanks!
Thank you for this wonderful programme! I am plotting a bacterial chromosome and find that when I plot the NC_000913 chromosome using the example script, I get the error:
line 217, in calc_gc_content gc_content_list.append(SeqUtils.gc_fraction(subseq) * 100) AttributeError: module 'Bio.SeqUtils' has no attribute 'gc_fraction'.
Is there a code update for this?
Please install Biopython with v1.80 or higher. If biopython>=1.80, there should be no errors.
Thank you for responding so quickly - this works perfectly!
Thank you for this wonderful package. I am plotting a fusion gene circle picture, I notice parts of genes and lines which positions of genes are not corresponding.eg:Zm00001eb270980