Blog:How to choose Normalization methods (TPM/RPKM/FPKM) for mRNA expression
1
0
Entering edit mode
13 months ago
Novogene ▴ 410

Why do mRNA expression values need to be normalized?

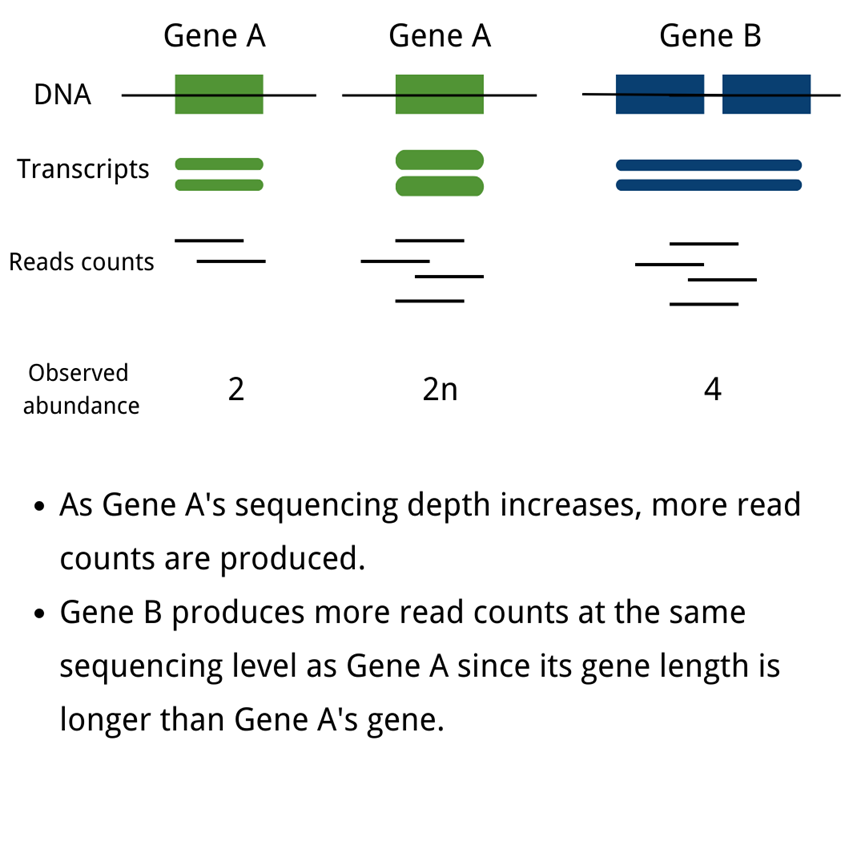
The unification of mRNA expression value measurements across studies, or the normalization of mRNA data, is a significant problem in biomedical and life science research. The abundance of transcripts is measured digitally by reading count. To eliminate technical biases in sequenced data, such as sequencing depth(deeper sequencing depth produces more read counts for one gene) and gene length(longer gene length produces more read counts at the same sequencing level), normalization of gene expression measurements is required.

image.png

Notes:

READ COUNTS:Obtained from the original sequencing data, the count number is the total number of reads mapped to a certain gene; in the sequencing analysis process, the measured short reads are firstly mapped to the reference genome, and then the software is used to calculate the number of reads mapped to a certain gene, which means that read count is an integer value.

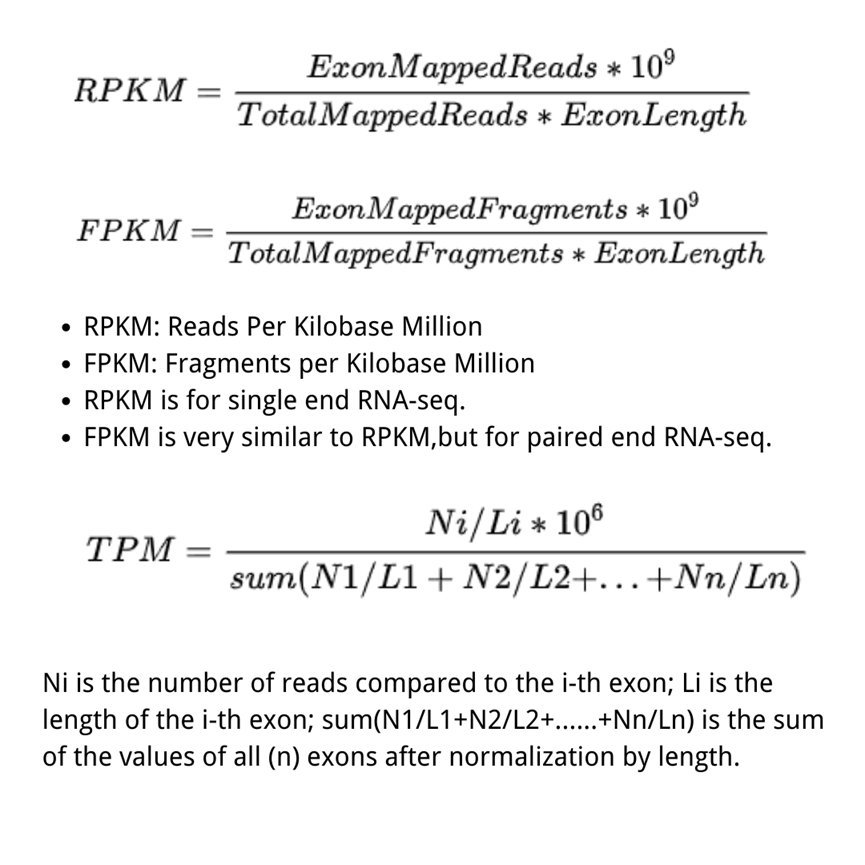
RPKM (Reads Per Kilobase per Million mapped reads)was made for single-end RNA-seq, where every read corresponded to a single fragment that was sequenced. FPKM (Fragments Per Kilobase per Million mapped fragments) is very similar to RPKM. We divide the number of fragments of a gene by the total sequencing depth, and the ratio is divided by the gene length. Note that, strictly speaking, the gene length mentioned above represents the total length of exons from one gene.

The difference between RPKM and FPKM is that F stands for fragments and R stands for reads. In the case of PE (Pair-end) sequencing, each fragment will have two reads, and FPKM only calculates the number of fragments that can be compared to the same transcript for both reads, while RPKM calculates the number of reads that can be compared to the transcript. The FPKM only counts the number of fragments that can be matched to the same transcript. In the case of SE (single-end) sequencing, the results calculated by FPKM and RPKM will be the same.

FPKM and RPKM ultimately normalize the abundance of transcripts from different samples (or the same sample under different conditions) to a standard that allows quantitative comparison by dividing both L (transcript length) and N (total number of Reads (Fragment)).

TPM (transcripts per kilobase million) is very much like FPKM and RPKM, but the only difference is that at first, normalize for gene length, and later normalize for sequencing depth. However, the differencing effect is very profound. Therefore, TPM is a more accurate statistic when calculating gene expression comparisons across samples. While using TPM, the sum of all TPMs are the same in each sample. This makes the comparison of the proportion of reads mapped to a gene in each sample very convenient.

image.png

How to choose the normalization method?

The TPM normalization results are sample independent and the TPMs are guaranteed to be the same across samples; however, the FPKM and TPM are about the same for each gene in each sample, so many people still use FPKM or RPKM to compare expression values of the same gene across samples. As with any high sequencing throughput technology, the analytical method is critical to interpret the data, and the RNA-seq analysis process is always evolving. Therefore, the appropriate method should be selected based on a combination of research directions.

Normalization method Description Recommendations for use
TPM(transcripts per kilobase million) Counts per length of transcript (kb) per million reads mapped Gene count comparisons within a sample or between samples of the same sample group;
RPKM/FPKM (reads/fragments per kilobase per million reads/fragments mapped) Normalize for gene length at first, and later normalize for sequencing depth Gene count comparisons between genes within a sample; NOT for between sample comparisons

Reference

  1. Dillies, Marie-Agnès, et al. "A comprehensive evaluation of normalization methods for Illumina high-throughput RNA sequencing data analysis." Briefings in bioinformatics 14.6 (2013): 671-683.
  2. Fundel, K., et al. "Normalization strategies for mRNA expression data in cartilage research." Osteoarthritis and cartilage 16.8 (2008): 947-955.

To get more information about Novogene, please visit our website: https://www.novogene.com/us-en/resources/blog/how-to-choose-normalization-methods-tpm-rpkm-fpkm-for-mrna-expression/

mRNA-seq gene-expression normalization-methods TPM • 6.6k views
ADD COMMENT
1
Entering edit mode

Your post comes late (at best) and honestly, with bad information. You say

TPMs are guaranteed to be the same across samples

which is absolutely not true. TPM is not comparable across samples, it can only compare within a sample - the number of transcripts is not guaranteed to be conserved between samples, which means a metric of the fraction of number of transcripts is not comparable across samples. A sample with 300 equally expressed transcripts will by default have all transcripts at 1.5X the level as a sample with 450 equally expressed transcripts.

While these metrics are still in use, creating a fresh blog post and discussing them as if they've not already been deemed inaccurate is faulty and negligent.

ADD REPLY
0
Entering edit mode

Thank you for your comments and corrections. I have corrected the places with omissions and errors to increase the quality of the information in the field of bioinformatics. If it were possible, we would want to work with you on content production.

ADD REPLY
7
Entering edit mode
13 months ago

When to use FPKM, when to use TPM, and when to use neither is an oft confused topic, so I think it useful to have an explanation when to use which. However, I think there are a couple of things that need clearing up with this post.

  1. Firstly, the order of normalisation (depth first or length first) is not really important in the distinction between TPM and FPKM. The important point is that TPM is explicitly normalised to the total expression in the cell, which FPKM isn't (although it is also not independent of the total expression, which is what makes it such a confusing metric). TPM for gene i is TPM[i] = 10^6 * (FPKM[i]/sum(FPKM)).

  2. TPM is effectively the fraction of transcripts in a cell that come from a given locus. That makes using it to compare between samples confusing and often misleading. While knowing that 1% of transcripts come from locus A in one sample and 2% come from locus A in another can be useful, and isn't in itself incorrect, it very definitely doesn't mean that expression has doubled between the two samples, which is how almost anyone working with TPMs instinctively thinks. This is because the meaning of 1% or 2% depends on the total number of transcripts in a sample, which is not something we ever know. Its also complicated by the number of reads sampled from a sample is independent of the number of transcripts in the sample.

  3. However, if your samples are sufficiently similar to each other, it can give you and _idea_ of if the expression of a gene is "high" or "low".

  4. TPM is more straightforward to interpret when you are comparing two loci within a sample. If we know that 1% of transcripts come from locus A in a sample, and 2% of transcripts come from locus B in the same sample, we can say that locus A is more highly expressed than locus B.

  5. RPKM/FPKM are more or less depreciated measures these days in RNAseq analysis, but they can be useful in other context, where the concept of a transcript is less useful. For example in looking at signal from ChIP seq peaks. FPKM might allow to say whether the promoter of locus A, or promoter of locus B is more bound by a factor.
  6. Again, RPKM/FPKM only really makes sense when comparing regions within a sample, not the same region between samples.
  7. Both measures make that assumption that all regions are similarly sequencable and mappable, and, for example, have the same GC bias, so that within a transcripts a fragment from locus A is just as likely to be sequenced as a fragment from locus B. We know that this assumption is false. We don't know, generally, how false.

To conclude, only use either FPKM or TPM when you are comparing entities within a sample, never when comparing entities between samples. In these cases use TPM where possible, which generally means anything to do with RNA, and FPKM when the idea of the total [transcriptome] doesn't make sense, like ChIP peaks. If you really need to do an analysis where you compare both within and between samples, TPM is probably a better bet, but you will probably need a further normalisation step in that case.

ADD COMMENT
2
Entering edit mode

To add on this, neither of the mentioned methods accounts for compositional differences (see here for example for a great explanation) between RNA-seq libraries. See here for an ilustration how skewed normalization can be when comparing naive per-million scaling (which TPM and FPKM essentially are) compared to more sophisticated methods: TMM-Normalization

ADD REPLY
0
Entering edit mode

Yes. This is what i mean in point 2 - TPM is a compositional method. Each TPM is the proportion of transcripts from a locus, and collectively all TPMs for a sample describe the composition. A fall in TPM from 2% to 1% _could_ be due to an decrease in expression if accompanied by a change the total number of transcripts in a cell. Conversely it could be caused by an increase in the expression of another locus if the total number of transcripts in the cell is constant. Either way, the change in proportion is real, but we have no way to tie that to a change in expression or not.

However, composition is often the best we have, for example, you can't use TMM when you only have one condition, and you can't use quantile-normalised counts to compare two genes within one sample.

ADD REPLY
0
Entering edit mode

you can't use quantile-normalised counts to compare two genes within one sample.

What if you follow up with a gene-level normalization (such as done by UQpgQ2 here)?

ADD REPLY
0
Entering edit mode

No, that still wouldn't change the fact that longer transcripts would have higher counts for the same expression level.

ADD REPLY
0
Entering edit mode

If we were to get a per-gene z-score, could one compare across genes then? Wouldn't it then be kind of like ranking samples by gene expression?

ADD REPLY
0
Entering edit mode

it still wouldn't really tell you if GAPDH is more highly expressed than ACTB.

ADD REPLY
0
Entering edit mode

I personally think that TPM is actually one of the most honest measure we have. It recognises that RNA-seq is an inherently composition method.

When we do something like TMM, upper-quantile or DESeq2 normalisation, we are making various assumptions about the statistical distributions that we don't really have any evidence for the truth of (e.g. the mean lfc is 0), and using these assumptions to try to twist inherently compositional data into a non-compositional intellectual framework.

ADD REPLY
0
Entering edit mode

Of course, that doesn't mean TPM is useful for answering the sorts of questions that are most commonly asked of RNAseq data.

ADD REPLY

Login before adding your answer.

Traffic: 2736 users visited in the last hour
Help About
FAQ
Access RSS
API
Stats

Use of this site constitutes acceptance of our User Agreement and Privacy Policy.

Powered by the version 2.3.6