Hello Everyone,
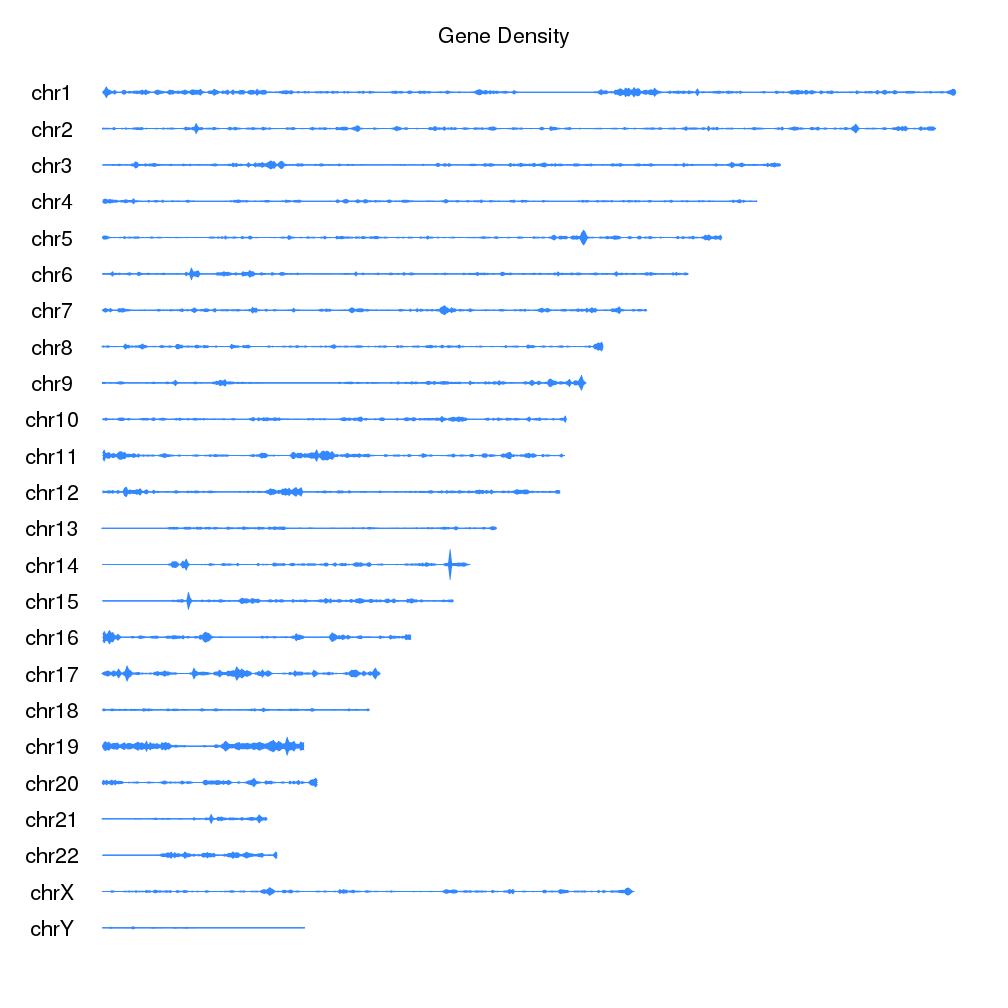
So I have a whole load of data generated from window based analyses across the genome (Fst, diversity, divergence etc). I am looking for an effective way to plot this data in a way that one can see clearly an overview of the results of these analyses across the chromosomes.
I have been using R and ggplot for some basic plots but these are of one chromosome at a time and I'd really like a way to plot all the chromosomes together, so that although detail is lost you get a good overview and can see obvious outlier regions in the genome. Are there any good scripts or tools available for this where you can plugin window based data or does everyone use their own custom scripts for visualisation?
Something along the lines of Figure 2a in the flycatcher genome is what I am thinking of :
http://www.readcube.com/articles/10.1038/nature11584
If anyone can suggest anything for this or a similar way to effective visualise window based analyses of whole genome data that would be great. Thanks in advance.
Best,
Rubal


thanks I will look at those