Entering edit mode
7.8 years ago
jennysjaarda
▴
10
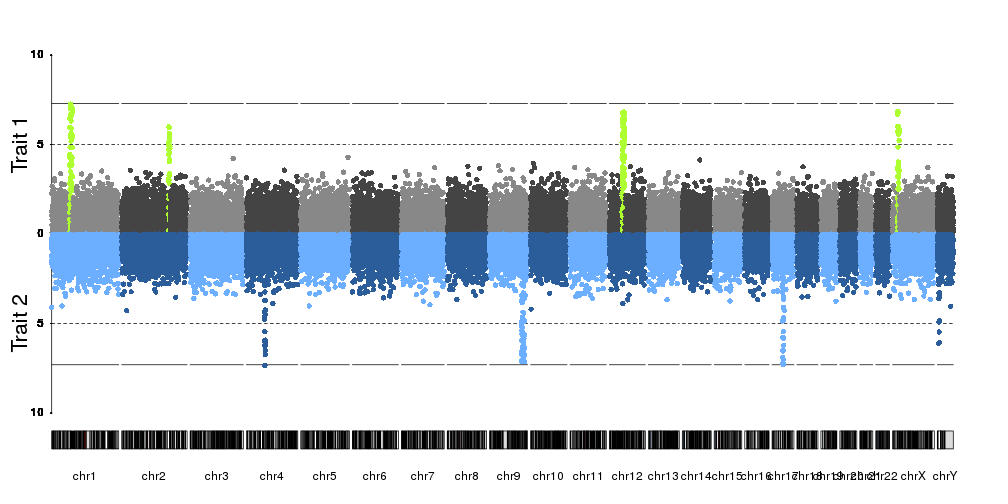
Does anyone know how to adapt the qqman Manhattan plot (or other function) to create a mirror image Manhattan plot as seen here (i.e. reverse the axis on the bottom plot): https://www.researchgate.net/figure/284888365_fig2_Fig-2-Manhattan-plot-of-the-Burmese-head-deformity-GWAS-and-SNPs-genotypes-within


Did you try to invert the ylim option. Intead of c(0,10) for example, try c(10,0).
They are called Miami plot. (Because of the reflection of buildings on Miami biscayne bay)
Related SO post: