Entering edit mode

2.1 years ago
Lena
•
0
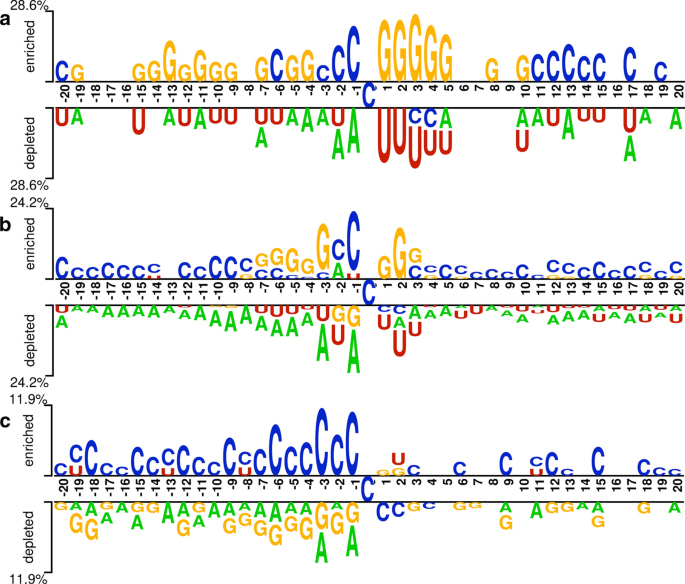
Hello, i'm trying to plot using python: a plot which represents nucleotides distribution. Can't seem to find the appropriate code/function.
Would be happy for some help. Here are some examples of what i'm trying to do:

Thanks!
