Entering edit mode

5.9 years ago
gundalav
▴
380
I have the following code:
library(Gviz)
library(Mus.musculus)
library(data.table)
library(OrganismDbi)
library(TxDb.Mmusculus.UCSC.mm10.knownGene)
txdb <- TxDb.Mmusculus.UCSC.mm10.knownGene


# Define bam file -----

adipose_bam <- "myfile.bam"

# Define region -----------------------------------------------------------
thechr <- "chr3"
st <- 116.108e6L
en <- 116.1317e6L


# Define track ------------------------------------------------------------

itrack <- IdeogramTrack(
  genome = "mm10", chromosome = thechr
)

grtrack <- GeneRegionTrack(
  txdb,
  chromosome = thechr, start = st, end = en,
  showId = TRUE,
  name = "Gene Annotation"
)


gtrack <- GenomeAxisTrack(cex = 1) # set the font size larger

adipose_altrack <- AlignmentsTrack(
  adipose_bam,
  isPaired = TRUE, col.mates = "deeppink",
  name = "Adipose", fill = "blue", col = "blue"
)


plotTracks(
  list(itrack, gtrack, adipose_altrack, grtrack),
  from = st, to = en
)
It produces this plot: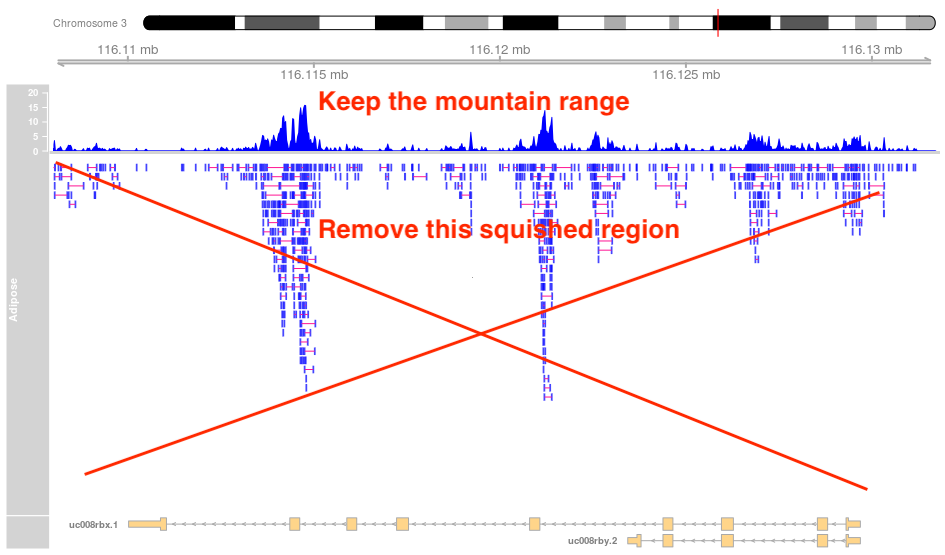
As define in the image how can I remove the squished track?
