
Hi,
To check for ASE, I performed multisample gDNA variant calling using GATK and got heterozygous biallelic sites for which I looked for RNA-seq read counts for both Ref and Alt alleles at those sites. I used allelecounter (v0.6) for that (https://github.com/secastel/allelecounter). More information- I performed joint variant calling using 81 water buffalo samples (GATK v4.0.4.0), after which I separated 4 samples from the multisample VCF whose RNA-seq data I had got. BAM files for 14 RNA-seq samples were generated using HISAT2 after which allelecounter was used to count allele-specific read counts. The 14 RNA-seq samples are a mix of total RNA-seq and mRNA-seq. The problematic samples are from total RNA-seq. There are other total RNA-seq samples as well in the set, but they don't show any problem.
For checking reference mapping bias, I generated plots for 14 RNA-seq samples. Two of the plots had multimodal distribution showing extreme imprinted loci which cannot be true.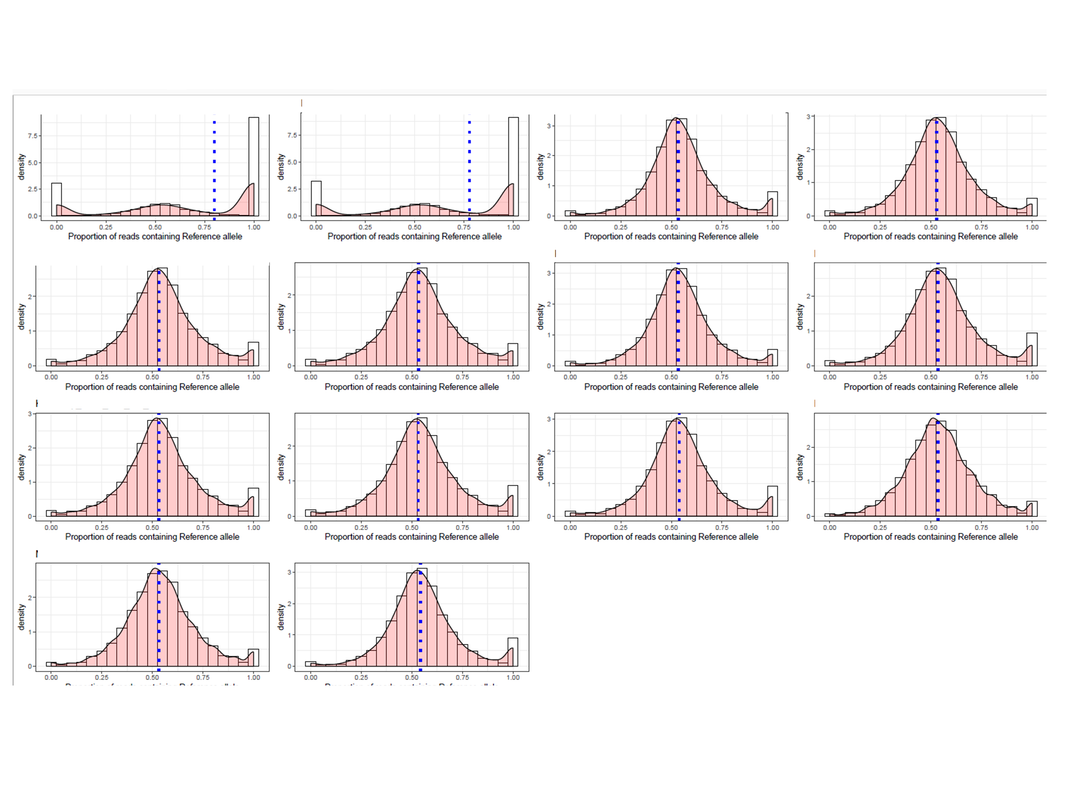
What can be the reason for this and why is it showing only in the two samples? Just to add, the two sample produced such plot because there are many loci that were genotyped as a heterozygous site, but in the RNA-seq data, those sites have reads supporting either ref or alt allele only. I am aware that some sites will be like that (tail of the distribution), but so many?? If more information is needed, I will be glad to share.
Interesting. Have you done some basic QC of the mRNA-Seq samples? Usually you would do clusters/PCA/MDS etc to check the status of replicates, control/treatment differentiation, or even simple total mapped read numbers (for normalization). For me, the first two samples seem to have lower than normal read counts in general, compared to the other samples. Maybe they are the outliers in the mRNA-Seq experiment.
Hi Vitis,
Thanks for the reply. I have not done that. My basic QC was limited to fastqc visualisation and trimming. I forgot to mention that the problematic samples are from total RNA-seq. My 14 samples have a mix of mRNA-seq and total RNA-seq samples. I have updated my post now.