
Hi,
I'm currently analyzing some bee genomes (honey bees, bumble bees, wasps) and doing some linkage disequilibrium tests on the SNPs. The method I'm using is Plink 1.9 --r2 with mostly default parameters.
All three data have been yielding lots of r2 and dprime with values of 1, almost regardless of the distance between the SNPs.
Bumble bee is entirely comprised of drones, which are haploids so I initially thought that was the issue. However, boney bee and wasp data includes worker genome, so they should be diploids.
Now I'm suspecting something else to be the problem, but can't guess what that could be.
Setting minor allele frequency cut off to 0.3 removes some chunk of the r2 of 1s, but also removes some other points as well. Also tried using vcftools hap-r2 or geno-r2, but those run for hours and never finish.
Would appreciate any helps and pointers and thank you in advance.
Problem solved. Switched to vcftools (not sure why my data didn't work well in Plink, but might be that it was haploid), which still showed issue, but in a different way. Then averaged the LD values for every given distances and the graph came out clean.
Ooh! how did you average LD values for given distances?
To calculate LD across ~220 individuals in ~10 populations, I used vcftools --r2 and filtered for R.2 in SNPs of the top 100 longest scaffolds of my assembly. It seems like the mean values are still wacky... or I haven't found out an effective way to group the distances.
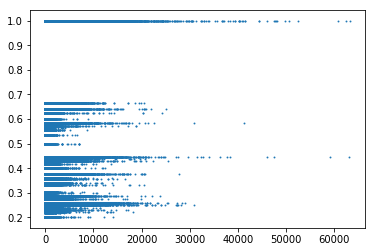
Here's the raw output from vcftools
Looks like this (pardon the external link, couldn't get the embedded images to work)
LD
Still, if I try to summarize LD by distance class
LD by distance class
There's still no decay in LD even at 8Mb...
Any ideas or suggestions would be appreciated! Thanks!