Transcript length distribution plot, based on genome + annotation
1
0
Entering edit mode
4.1 years ago
tanya_fiskur ▴ 70

Hi everyone!

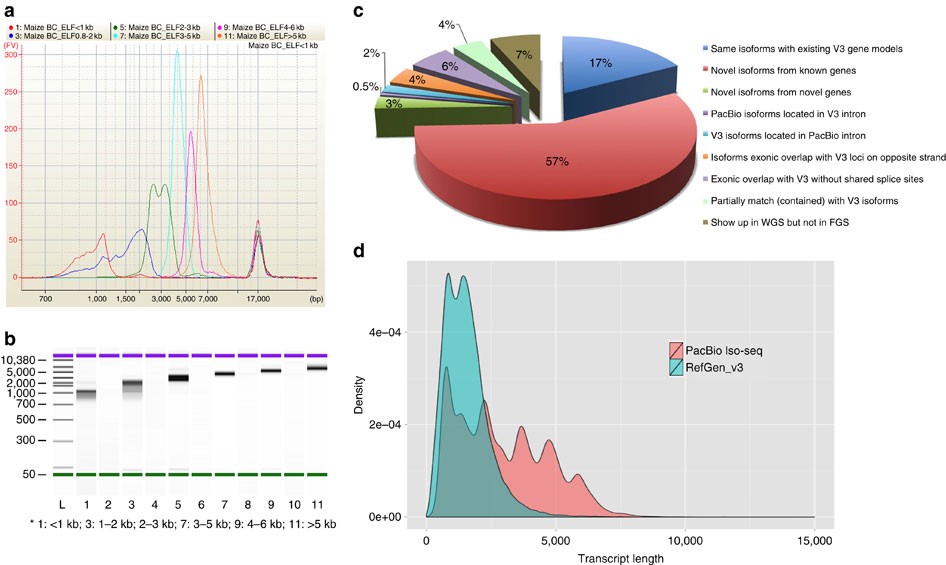
I am really wondering, with which tool is it possible to make a plot of transcript length distribution, based on the genome + gene annotation, like it was done here (figure D).

In the article itself and in the supplementary materials it is not mentioned.

Thanks very much in advance!

https://www.researchgate.net/figure/Maize-PacBio-Iso-Seq-barcoding-library-and-comparison-of-isoforms-between-RefGen-v3-and_fig2_304404925

pacbio genome • 2.1k views
ADD COMMENT
1
Entering edit mode
4.1 years ago

This plot was made in R with ggplot2. If you are asking about the data used you would need to find it yourself. RefGen is likely the standard reference annotations (available here). You would need to look for the source for the PacBio iso-seq data and whatever format it is in.

library(reshape2)
library(TxDb.Hsapiens.UCSC.hg38.knownGene)
library(ggplot2)

## my genome resource (human)
tx <- TxDb.Hsapiens.UCSC.hg38.knownGene

## get a vector of all transcripts lengths by gene
b <- width(transcriptsBy(tx,by='gene'))

## split randomly into two halves and sum the transcripts lengths for each gene (this is just an example and probably not the ideal way to calculate lengths)
tx.half1 <- sum(b[1:13000])
tx.half2 <- sum(b[13001:26000])

## merge both into a data.frame
tx.df <- melt(list('set1'=tx.half1,'set2'=tx.half2))

## plot (I also force the x-axis to stay within the limit pictured in your reference plot)
ggplot(tx.df,aes(x=value,fill=L1)) + geom_density(color='black',alpha=0.5) + xlim(c(0,150000)) + xlab('Transcript length') + ylab('Density')

enter image description here

ADD COMMENT
0
Entering edit mode

The paper clearly states that the PacBio Iso-seq data is available:

Accession codes: The PacBio data sets generated for this work is accessible through NCBI Sequence Read Archive under accession number SRP067440.

If you want to use the PacBio data you would need to download and process that raw data according to their methods (unless they have prebuilt uploaded annotations somewhere else - or maybe you could ask the PI directly?)

ADD REPLY
0
Entering edit mode

Thank you very much for the code! I have another pacbio data and gtf annotation, and want to create a similar plot. Probably, the gffcompare output can give me the lengths of the transcripts.

ADD REPLY
0
Entering edit mode

Another option if you are using R (similar to my code) is to use your GTF file to produce a TranscriptDb object similar to the package-derived one used in my code.

tx <- makeTxDbFromGFF('your.gtf')
ADD REPLY
0
Entering edit mode

Thank you! And does the transcriptsBy function work with the gtf-derieved file? Also, did I understand you correctly that you split the data in two halves just to show two overlapping plots, these is no other reason to do it?

ADD REPLY

Login before adding your answer.

Traffic: 2455 users visited in the last hour
Help About
FAQ
Access RSS
API
Stats

Use of this site constitutes acceptance of our User Agreement and Privacy Policy.

Powered by the version 2.3.6