Entering edit mode

8.8 years ago
mbk0asis
▴
700
Hi
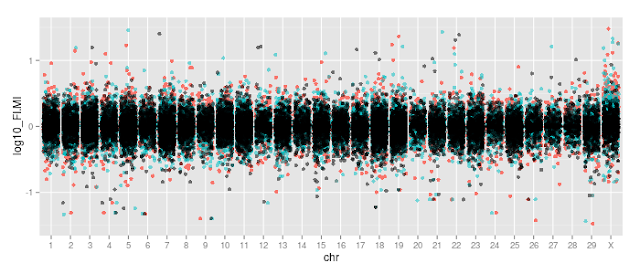
I made a jitter plots with 3 data set overlaied in a single plot. What I tried to do was setting each data different colors, but the colors weren't changed right. The colors seemed to be automatically assigned to each data set. Does anyone know the reason here?
Here's the R code
ggplot(
  All,
  aes(
    x=chr,y=log10_FI.MI)
  ) + guides(colour=FALSE) +
ylim(c(-1.5,1.5)) +
geom_jitter(
  alpha=1,
  size=2,
  position=position_jitter(width=0.4),
  aes(color="blue")
) +
geom_jitter(
  data=All,
  aes(x=chr,y=log10_FN.MI,color="red"),
  alpha=0.5,
  size=2,
  position=position_jitter(width=0.4)
) +
geom_jitter(
  data=All,
  aes(x=chr,y=log10_MN.MI,color="grey"),
  alpha=0.5,
  size=2,
  position=position_jitter(width=0.4)
)
and the plot
Thank you!

Thank you! So where should I put the vector colors? I'm a newbie, so please bear with me...