
Hi everybody,
I am trying to work with the csaw package on my data, but I am not sure, whether or not the package fits to my needs.
We are working on a S. cerevisiae data set where we induced a specific double strand breaks on two specific positions on the genome in the DNA and would like to see what happen in these regions in term of protein binding.
We have done an IP for specific proteins for a wild-type and a double mutants for two genes on different time points. I have mapped the reads using bowtie and used R to counts reads per gene/region.
In my first attempt I've analysed the data with the edgeR normalization based on a arbitrary window size of 500bp to view the peaks (see attached image). The results I am getting with this method are as expected, but they don't tell me the significance of the found peaks.
For that reason I wanted to try the csaw method, but I am having a few problems with the workflow.
First of all I would like to add that we don't have any replica (we are working on additional files, but for now I have only one sample per condition)
Cross-correlation plot:
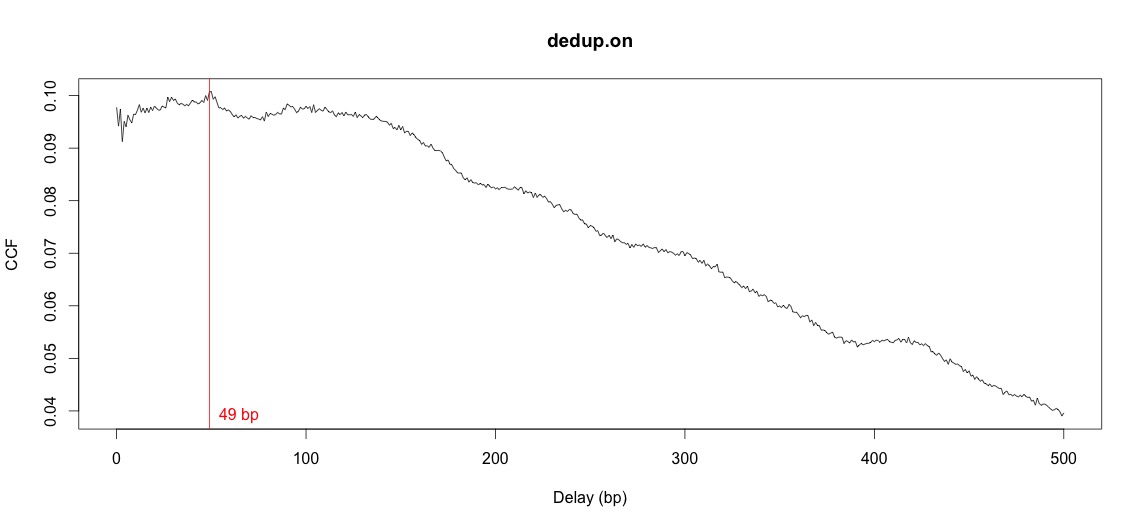
When I try to calculate the fragment length from the cross-correlation plots, I get a completely different value than expected. According to the sequencing center the frag. length was 200-300 (~250)bp, but csaw gives me the value of 140bp if I take all samples together and a value of 49 if I calculate the pair-wise comparison (2 samples). also the plots don't look like the example in the script at all.
MA plots:

Composition biases:

Efficiency bias plots:
A second issue is the MA plots, which look completely different than what one expected them to look like. instead of being equally distributed on both sides of the 0 line, they look very skewed toward the negative values. I have tried to filtered the data by counts, by global enrichment and by proportion and than normalize the data to eliminate composition biases (which I don't think we have), but also and more important to correct for efficiency biases, which I assume are more important in my case, as I expect the peaks in the different libraries to differ greatly.
As I am not expecting an equal distribution of peaks all over the genome, but basically only specific peaks at the place of double strand breaks, I am not sure which normalisation or filtering steps to take to make sure that I get significant peaks.
I would appreciate any help I can get and would like to thank in advance for that.
Tomas
