
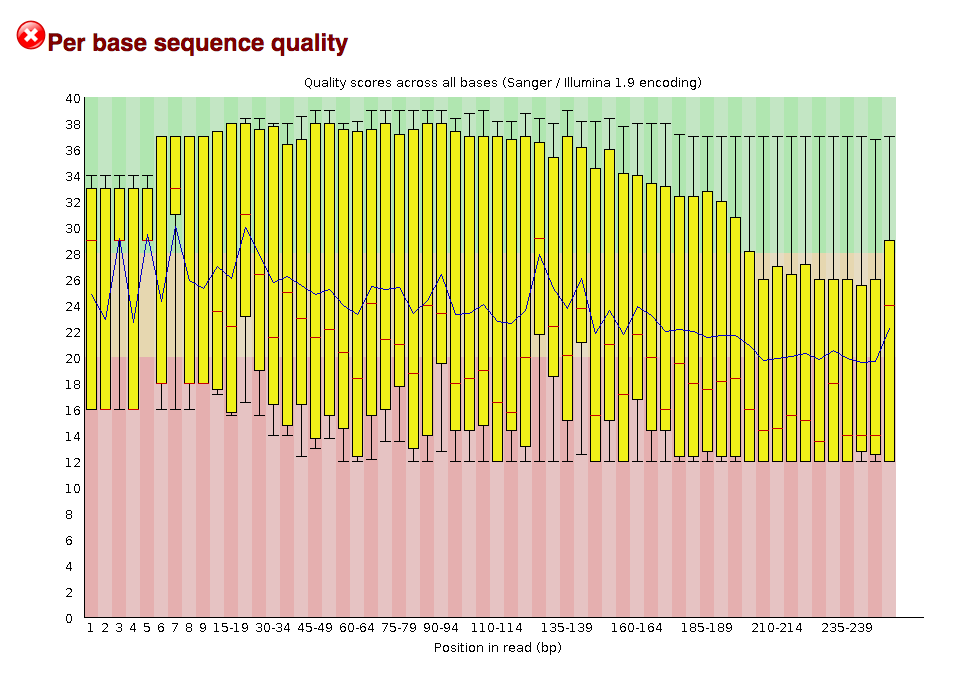
I have some RNA-seq data that I trimmed and then ran through FastQC to check the quality. For the R2 file for my read, there seems to be a bad quality score for a large portion of the reads. A lot of the reads are in the red zone.
However, closer examination into the Mean Sequence Quality of each reads, it looks like there are two populations: one large set of reads with bad quality throughout the reads (hence the bad mean sequence quality) and one set of reads with overall good quality (hence the >30 mean sequence quality scores)
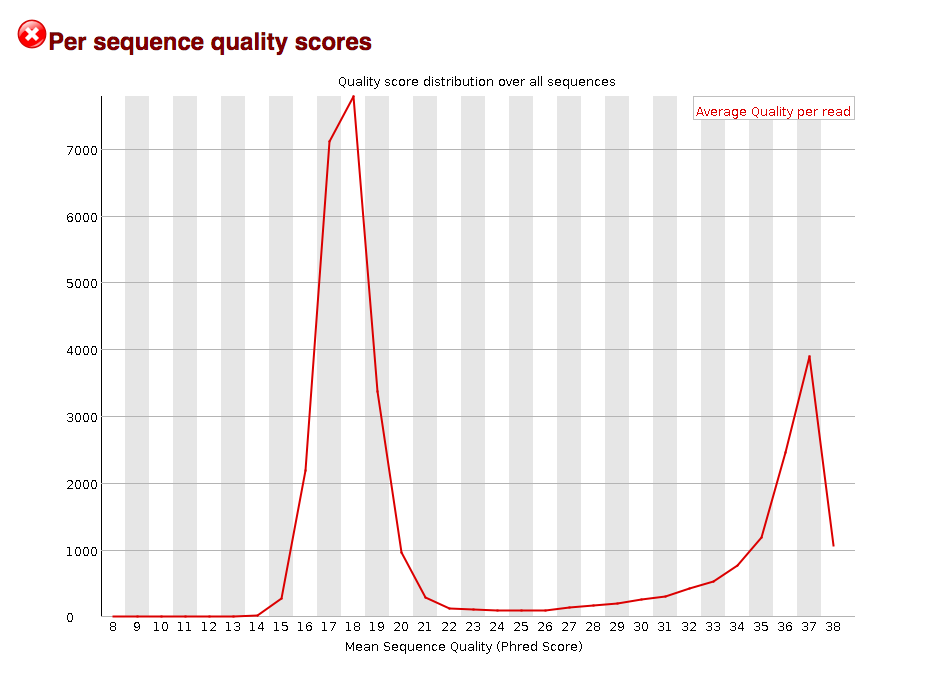
I would like to isolate the good quality reads with the >30 mean sequence quality. It looks like some mapping programs (like STAR) look at the quality score average for each base. However, that would not help to isolate the good quality reads because the calculated average for each base includes the quality scores of both the bad and good quality reads.
Is there a separate program out there that can remove the low Mean Sequence Quality reads. Or do some alignment programs already take this into account? Or, is my logic to separate reads of differing quality inherently flawed?
Also, I am assuming a good quality read has a Mean Sequence Quality > 30.
