Entering edit mode

5.4 years ago
Nate
▴
10

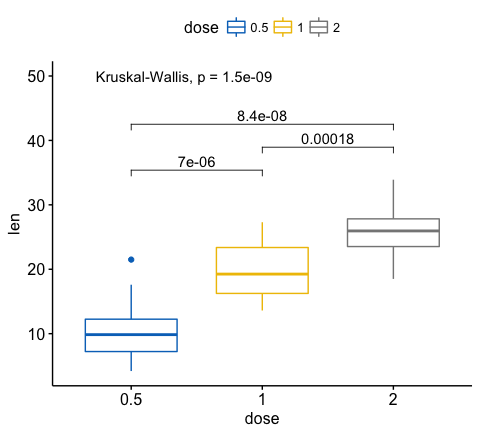
I am looking to create plots like this where p-value is shown at the top. Does anyone know any good package that can generate graphs as such easily? I know ggplot2 is possible, but is that the only way? It is because it is long!