
I am a comp-chemist and this is my first time trying RNA and I have little in the way of support in biology. The experiment is a mouse model (mouse cells were sequenced and I ended up with bulk paired-end reads) over 30 days, control vs treated. The experimental metadata:
Sample_ID Duration Treatment Conc Total_volume RIN Location
CC1 chronic vehicle 14.1 30 7.2 COMBINED/CONTROL_CHRONIC/CC1
CC2 chronic vehicle 14.9 30 7.2 COMBINED/CONTROL_CHRONIC/CC2
CC3 chronic vehicle 19.9 30 7.5 COMBINED/CONTROL_CHRONIC/CC3
CC4 chronic vehicle 11.3 30 7.7 COMBINED/CONTROL_CHRONIC/CC4
CC5 chronic vehicle 8.18 30 7.9 COMBINED/CONTROL_CHRONIC/CC5
CC6 chronic vehicle 12 30 8.3 COMBINED/CONTROL_CHRONIC/CC6
CG1 chronic GTN 22.5 30 7.2 COMBINED/EXPOSED_CHRONIC/CE1
CG2 chronic GTN 17.6 30 7.9 COMBINED/EXPOSED_CHRONIC/CE2
CG3 chronic GTN 16.1 30 7.5 COMBINED/EXPOSED_CHRONIC/CE3
CG4 chronic GTN 15.9 30 8.2 COMBINED/EXPOSED_CHRONIC/CE4
CG5 chronic GTN 13.8 30 8 COMBINED/EXPOSED_CHRONIC/CE5
CG6 chronic GTN 25.8 30 7 COMBINED/EXPOSED_CHRONIC/CE6
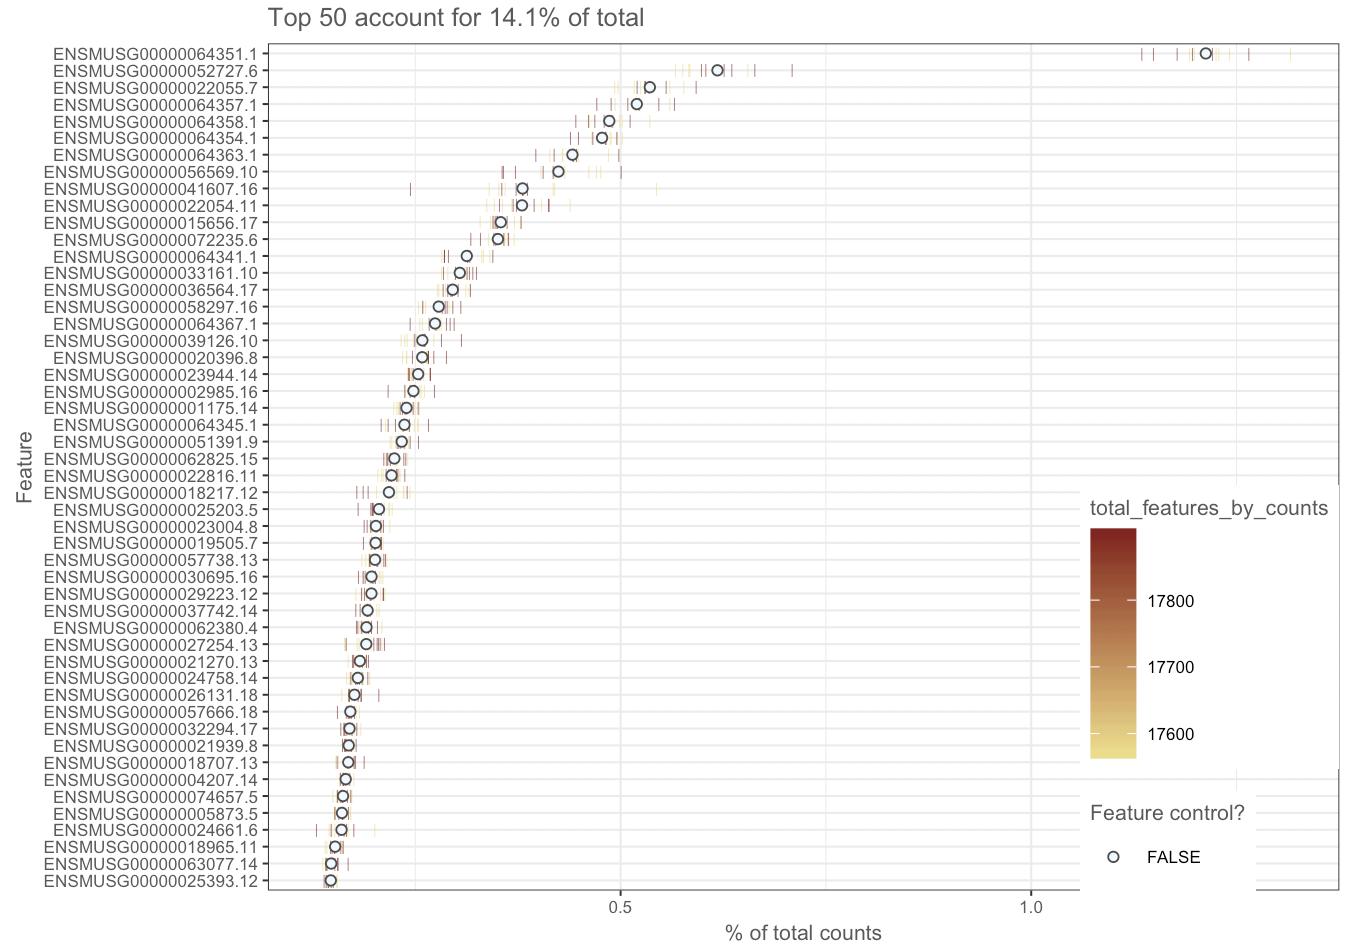
I'm using Scater to take advantage of the QC plotting features, I can put together the code but I am a little lost when it comes to interpreting the output. My first QC metric has been the raw expression of the top N number of genes. I've listed the top ten and plotted the top 50. Within those top ten are mitochondrially encoded protein. I've done a bit of background reading and this might suggest either cell death or lysed cells?
With your experience, what would you interpret from this aspect of the QC alone?
ENSMUSG00000064351.1 - COX1 - mitochondrially encoded cytochrome c oxidase.
ENSMUSG00000052727.6 - MAP5 - microtubule-associated protein 1B.
ENSMUSG00000022055.7 - NF-L - neurofilament, light polypeptide.
ENSMUSG00000064357.1 - ATPASE6 - mitochondrially encoded ATP synthase 6.
ENSMUSG00000064358.1 - COX3 - mitochondrially encoded cytochrome c oxidase III.
ENSMUSG00000064354.1 - COXII - mitochondrially encoded cytochrome c oxidase II.
ENSMUSG00000064363.1 - URF4 - mitochondrially encoded NADH dehydrogenase 4.
ENSMUSG00000056569.10 - P0 - myelin protein zero.
ENSMUSG00000041607.16 - Hmbpr - myelin basic protein.
ENSMUSG00000022054.11 - NF160 - neurofilament, medium polypeptide.
If you want to do QC on your RNAseq data then you can use: http://rseqc.sourceforge.net/ or Picard CollectRnaSeqMetrics.
You may need to describe what this experiment is about (sample, treatment type, biological replicates etc) for people to be able to comment on your specific observation above.
Thanks. I've added the experimental metadata into the post. As for the various tools, thanks for that. I'm trying to keep the number of tools to a minimum as it' a bit overwhelming at the moment, reminds me of the basis-set alphabet soup in QM chemistry.
Apologies for additional questions. What is the actual sample that is being analyzed for RNA? Cells in culture, cells from actual mice, whole organs, blood? Are all of these samples taken at 30 days (i.e. there is no 0 day control)? Good to see that you have 6 biological replicates. Do you expect the treatment to cause cell lysis/up-regulate mitochondrial gene expression?
Are those selected using top adjusted p values after DESeq2?
Oh I see. Not a problem. This is all cell samples from mice. I do not expect the treatment to cause cell lysis/up-regulate mitochondrial gene expression (the latter, at least as far as I know).
These are not selected after DESeq2. This is the QC analysis from Scater immediately after counts are imported from Salmon using tximport. I might remove any mention of DESeq2 so not to add confusion otherwise my process looks like I went from cell samples all the way through to diff gene expression then back again to perform QC analysis.
Ah so you have not actually completed your DE analysis. Then I suggest that you go through with complete DESeq2 analysis. At this point looking at top 50 genes by counts may not mean much since the data has not been normalized.
Right I see. That is quite helpful to know. So, I have actually completed a complete DESeq2 analysis, however, the recommendation I've had from a Prof in Bioinformatics that I work with (very off hand due to distance and hence my posts here), isn't interested in any end-game outcome until a thorough QC analysis of the reads is complete. I am now beginning to suspect, and I would appreciate your thoughts, that the data I have posted here is to be interpreted at the latter stage of the RNA seq work flow?
QC on raw data is generally completed using a program called FastQC. That is what you should be using with your raw data. You are mainly looking for presence of adapters, odd nucleotide distributions etc in your data. There is a collection of blog posts from authors of FastQC that you will find useful as you try to interpret the results. Two main things to keep a lookout for are sequence duplication and positional sequence bias seen in RNAseq data. If your QC shows presence of adapter contamination then you should trim your data though most aligners will do that by "soft-clipping". Since you have mouse data you will want to use an aligner that is splice aware.
At this point you could use one of the RNAseq specific QC tools I had originally linked above to see where you reads maps (intronic, exonic, 5' or 3' bias and several other things).
Out of curiosity do any of the genes you post above show up in the list of significantly DE genes in DESeq2 results?
Ok, that's great. Thanks, I'll look into those. This is all very new to me and I work down to the wire so I don't have much time to learn and pick up the techniques. I had the impression that there was (for want of a better word) an intermediate QC stage i.e., how do the samples sit across varying degrees of PCAs? Does Vehicle separate from Treated? etc.
You can do PCA etc. Examples of how to do that are in DESeq2 vignette (which I will assume you have seen).
No special skill is needed to use FastQC. It is a java program and can be run entirely on the command line. You will want to use MultiQC to aggregate your results so you are not looking manually through many files.