Entering edit mode

4.8 years ago
zhaoliang0302
▴
50
Hi,
I detected several outliers among my samples by plotting PCA. But I don't know how to remove this samples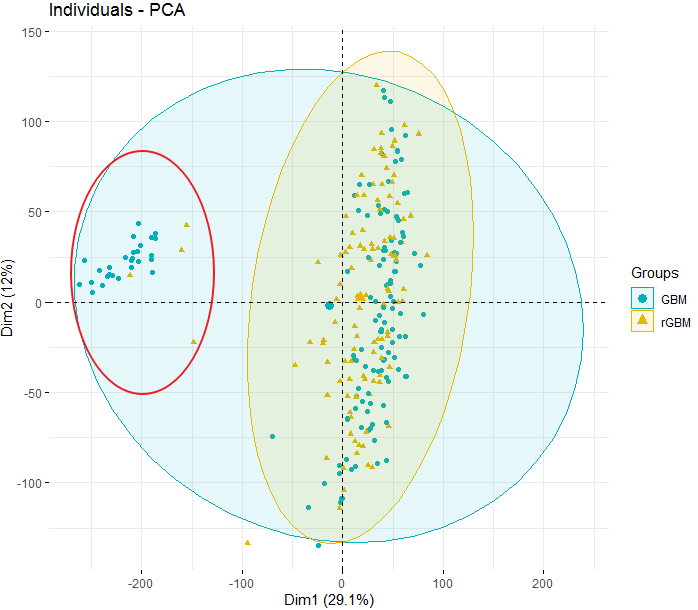 The outlier samples is marked by the red circle.
Thanks
You should explain how you generated your PCA plot (from which type of data ? ). Put your code. And a minimal reproducible example.
The data is a dataframe of RNAseq FPKM expression file, rows correspond to genes and columns to samples.
My first question with such a plot is, what are these outlier samples? Is there a biological or technical explanation for this?
I downloaded this RNAseq data and just explore it. Considering the large samples, I think remove these 'outlier' samples is not a risk.
Are all samples from the same dataset ? Do you have metadata on this samples (sequencing kit ? type ? cell type ? sequencing plateform, etc...) IMO you see here a clear (non-biological) batch effect
Yes, all tumor samples are from the same dataset. The clinical data doesn't contains batch information. So I want to remove these samples directly.
I guess in the
pcaobject you should havePC1andPC2(information used to plot). Use these to filter out the samples i.e.PC1 < -100Thanks, I save this plot as PDF file (large size) and then zoom in to get the outlier samples. It sounds silly but it really works :-)
Hi, I am also facing the same issue, and by checking your suggested method I am finding the actual sample which have pc1 < -100 are outlier. Please can you share explanation what is the basis of the threshold selection of -100. It would be much helpful. Thank you.
ues fviz_pca_ind(pca_all, geom.ind = "text") to show sample names on the plot.