Galaxy Taxonomy Output To Newick Tree
1
1
Entering edit mode
12.0 years ago
Zach Powers ▴ 340

Hi Biostars,

I would like to take the output of Galaxy's Metagenomic Analyses > Fetch Taxonomic representation and make a Taxonomic tree that contains abundance information. For display, I could then experiment with the the many excellent visualization softwares out there ( i am particualry interested in the ETE2 library) . This question is very similar to a previous question where the author was reccommended to use iTOL for a similar purpose. I am wondering, however, if it possible to generate an abundance-information-containing Newick tree directly from the Galaxy Metagenomic Analyses output - ideally to provide a flexible replacement for the current taxonomic abundance-visualization tool. The values in the Newick tree could actually come from the

The data output is a table with a few identifier collumns and then the kindom/phlyum/class.... Here are a few lines (sorry that it wraps):

contig00428    562    root    Bacteria    n    n    n    Proteobacteria    n    n    Gammaproteobacteria    n    n    Enterobacteriales    n    n    Enterobacteriaceae    n    n    n    Escherichia    n    Escherichia coli    n    42469
contig00073    562    root    Bacteria    n    n    n    Proteobacteria    n    n    Gammaproteobacteria    n    n    Enterobacteriales    n    n    Enterobacteriaceae    n    n    n    Escherichia    n    Escherichia coli    n    42945
contig00672    562    root    Bacteria    n    n    n    Proteobacteria    n    n    Gammaproteobacteria    n    n    Enterobacteriales    n    n    Enterobacteriaceae    n    n    n    Escherichia    n    Escherichia coli    n    146126
contig00143    562    root    Bacteria    n    n    n    Proteobacteria    n    n    Gammaproteobacteria    n    n    Enterobacteriales    n    n    Enterobacteriaceae    n    n    n    Escherichia    n    Escherichia coli    n    287840
contig01215    562    root    Bacteria    n    n    n    Proteobacteria    n    n    Gammaproteobacteria    n    n    Enterobacteriales    n    n    Enterobacteriaceae    n    n    n    Escherichia    n    Escherichia coli    n    290448

Alternatively the 'Summarize Taxonomy tool' provides the following:

superkingdom    Eukaryota    9
superkingdom    Viruses    1
kingdom    Fungi    2
kingdom    Metazoa    5
kingdom    Viridiplantae    1
subkingdom    Dikarya    2
superphylum    Bacteroidetes/Chlorobi group    22
superphylum    Chlamydiae/Verrucomicrobia group    6
superphylum    Fibrobacteres/Acidobacteria group    8
phylum    Acidobacteria    8
phylum    Actinobacteria    9
phylum    Apicomplexa    1

any ideas would be appreciated, zach cp

galaxy taxonomy • 4.1k views
ADD COMMENT
0
Entering edit mode

Zach, how big (# of terminal nodes) are your trees?

ADD REPLY
0
Entering edit mode

jhc, the tree varies depending on the experiment but a few thousand is typical. I actually came across your Taxonomy Lookup and have been playing with it. It is similar to Pierre's but outputs the newick tree which I can then use with the ETE2 library for custom layout. (which is awesome - thanks!).

ADD REPLY
0
Entering edit mode
12.0 years ago

The following java code: https://gist.github.com/2787783 takes two parameters:

  • a directory for the dump of NCBI taxonomy
  • a file containing a list of taxonomy-id

    javac -Biostar45691.java java Biostar45691NCBITAXONOMY taxonsidlist.txt > result.gexf

it then produces a XML-based Graph (Gexf) .

<graphml xmlns="&lt;a href=" http:="" graphml.graphdrawing.org="" xmlns"="" rel="nofollow">http://graphml.graphdrawing.org/xmlns" xmlns:xsi="http://www.w3.org/2001/XMLSchema-instance" xsi:schemaLocation="http://graphml.graphdrawing.org /xmlns <http: graphml.graphdrawing.org="" xmlns="" 1.0="" graphml.xsd"&gt;&gt;="" &lt;key="" id="taxname" for="node" attr.name="Taxon.Name" attr.type="string" &gt;="" &lt;key="" id="count" for="node" attr.name="Count" attr.type="int" &gt;="" &lt;key="" id="countleaf" for="node" attr.name="CountLeaf" attr.type="int" &gt;="" &lt;graph="" edgedefault="directed" &gt;="" &lt;node="" id="28216" &gt;="" &lt;data="" key="taxname" &gt;Betaproteobacteria&lt;="" data&gt;="" &lt;data="" key="count" &gt;1&lt;="" data&gt;="" &lt;data="" key="countleaf" &gt;0&lt;="" data&gt;="" &lt;="" node&gt;="" &lt;node="" id="42256" &gt;="" &lt;data="" key="taxname" &gt;Rubrobacter="" radiotolerans&lt;="" data&gt;="" &lt;data="" key="count" &gt;1&lt;="" data&gt;="" &lt;data="" key="countleaf" &gt;1&lt;="" data&gt;="" &lt;="" node&gt;="" &lt;node="" id="2748" &gt;="" &lt;data="" key="taxname" &gt;Carnobacterium="" divergens&lt;="" data&gt;="" &lt;data="" key="count" &gt;1&lt;="" data&gt;="" &lt;data="" key="countleaf" &gt;1&lt;="" data&gt;="" &lt;="" node&gt;="" &lt;node="" id="2" &gt;(...)<="" p="">

You can open this kind of graph using gephi and visualize the usage of each taxon.

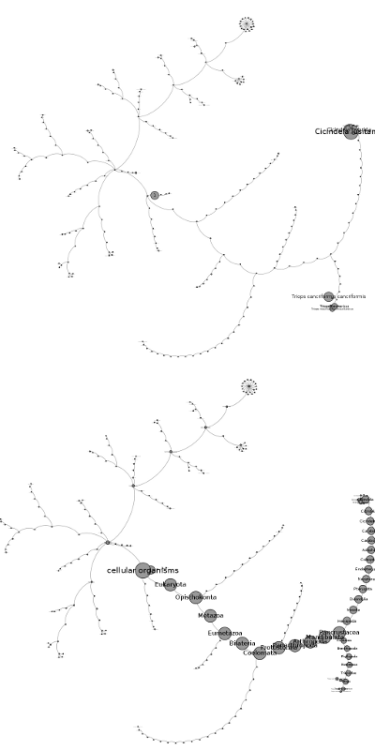
In the example below, I've displayed a few ~100 nucleotide having "16S RNA" in their title. You can use the number of times a taxon and his parents (lower) were found or only the count of each taxon from your list (upper)

enter image description here

ADD COMMENT
0
Entering edit mode

Pierre, thank you. This is basically what I am looking for except that I am unfamiliar with the gexf format. Is it possible to control tree shape/appearance? -- (I don't see anything like a phylogenetic tree in the Gephi documentation.)

ADD REPLY
0
Entering edit mode

gexf is a simple XML-based format describing a graph (nodes+edges) and used by gephi. Once opened in gephi, you can customize the graph (colors, layout, etc...) http://gexf.net/format/basic.html

ADD REPLY

Login before adding your answer.

Traffic: 1191 users visited in the last hour
Help About
FAQ
Access RSS
API
Stats

Use of this site constitutes acceptance of our User Agreement and Privacy Policy.

Powered by the version 2.3.6