
Hi,
I'm analyzing an RNA-Seq data set using DESeq2. While doing exploratory data analysis, I would like to plot a PCA of my data. In the PCA I would like to create three different grouping parameters - time, group and a third parameter called "with/without" ( an addition of a specific aggregate to the cells analyzed in the experiment).
my colData() looks like that
> colData(rld)
DataFrame with 48 rows and 6 columns
                           Short      time replicate        label      group sizeFactor
                        <factor> <integer> <integer>     <factor>   <factor>  <numeric>
Artificialno24_1 ArtMinus        24         1 ArtMinus24_1 ArtMinus24   1.320755
Artificialno24_2 ArtMinus        24         2 ArtMinus24_2 ArtMinus24   1.345653
Artificialno24_3 ArtMinus        24         3 ArtMinus24_3 ArtMinus24   0.930701
Artificialwith40_1 ArtMinus        40         1 ArtMinus40_1 ArtMinus40   0.919405
...
Amd I would like to visualize in my PCA plot the three categories - group, time and Short. But I can only think of color and shape in ggplot(aes(...) parameters. These are all categorical data (districte), so alpha is really a good solution.
Are there any other ideas out there, which one can use to create this kind of plot?
this is my command
ggplot(pcaData, aes(PC1, PC2, color=group.1, shape = time, alpha = Short) ) +
  geom_point(size=3) +
  scale_color_manual(values = c25) +
  geom_text_repel(aes(PC1, PC2, label = pcaData$name),size=2)  +
  xlab(paste0("PC1: ",percentVar[1],"% variance")) +
  ylab(paste0("PC2: ",percentVar[2],"% variance")) +
  coord_fixed() +
  guides(col=guide_legend(ncol=2  )) +
  theme(legend.text=element_text(size=4),
        legend.title = element_text(color = "blue", size = 4)) +
  coord_equal(ratio = 3)
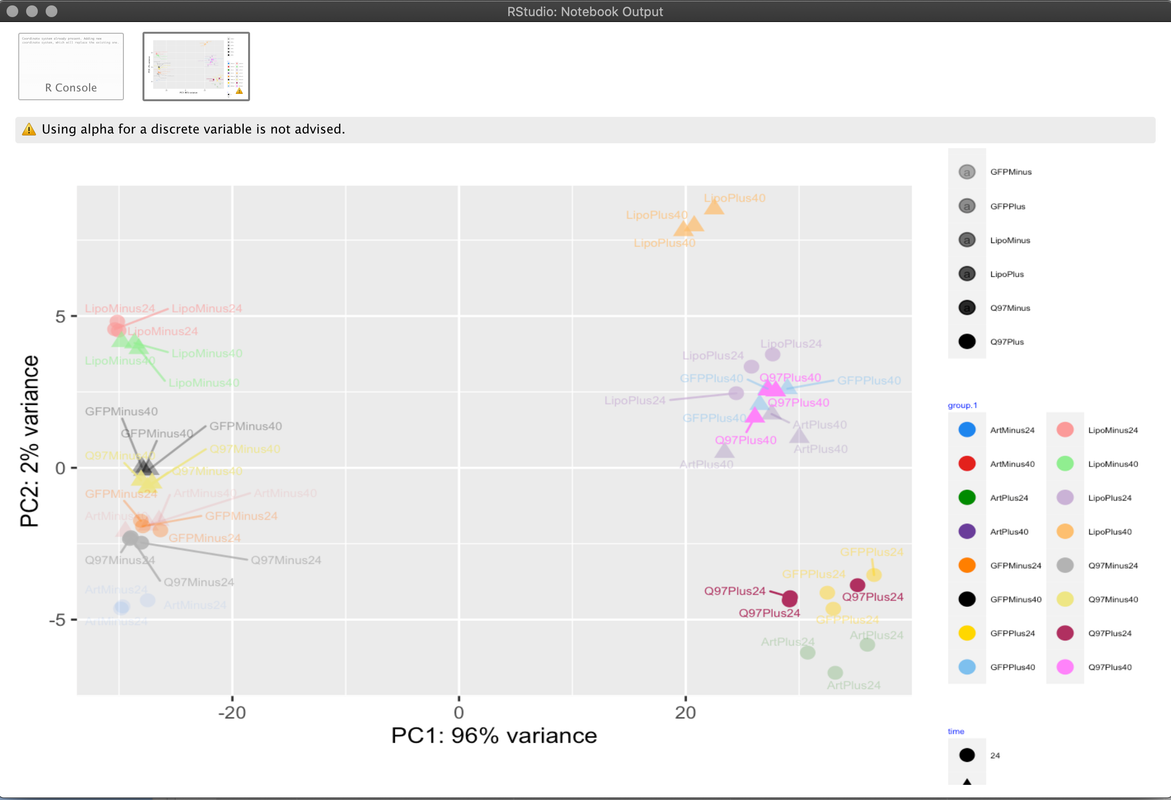
and how the plot looks like at the moment
thanks in advance
Assa
Depending on the point shape that you are using, you can use
colorto color the margin of the points/dots andfillto color the dots/points: http://www.sthda.com/english/wiki/ggplot2-point-shapes (like 21 to 25). You can set the size of the points/dots as well as the margin to highlight better.Though 3 grouping variables sounds too much. If somehow they group together by any variable, I would highlight that through color background circle around the points/dots that belong to distinct groups, like some of the plots at the end: https://tem11010.github.io/Plotting-PCAs/
thanks, that with the
colorandfilloptions is a good solution