How Does Average Heterozygosity Relate To Alellic Frequency Data
3
2
Entering edit mode
10.8 years ago
Duarte Molha ▴ 240

Forgive me if this is a dumb question but I assumed that the Average Heterozygosity was somehow related to the average distribution of frequencies seen for each allele in any given variation, i.e a AvHet close to 0.5 and a avHetSE lower than 0.1 would probably mean that that variation with 2 detected alleles would have a relatively balanced allele count for each like 0.45 for Allele A and 0.55 for Allele B.

Is my thinking flawed? I ask this because I filtered dbsnp137 using AvHet of >= 0.4 and avHetSE < 0.1 and I am getting loads of variations where 1 allele is clearly dominant with frequency count above 0.8.

I've tried to get my head around the maths for the AvHet calculation in http://www.ncbi.nlm.nih.gov/projects/SNP/Hetfreq.html but I admit defeat. I am not a Mathematician by training and could not make sense of it.

allele • 18k views
ADD COMMENT
0
Entering edit mode

Thank you for the detailed answers guys. They do make it much clearer but I am still perplexed why I am seeing such high allelic frequencies for the values of AvHet I had used to filter the dataset.

ADD REPLY
0
Entering edit mode

Take as an example this SNP:

ID: rs112111814 Alleles:C/T AlleleCounts:2137, 49 allele_frequencies:0.977585,0.022415 avHet:0.5 avHetSE:0

How can such a variation have a AvHet of 0.5 when 97% of seen alleles are C and less then 3% are allele T ?

ADD REPLY
0
Entering edit mode

It depends what you mean by 97% and 3%. Are these based on the 2137 counts? If yes, 3% amounts to 60 sequences. I don't know how many individuals you have nor your criteria for calling heterozygotes, but if you have 20 individuals, it is possible that in a few cases 50% of them will be called hetero (based on an average of 6 reads). In cases like this, I would suspect the presence of paralogs in your data set. For instance, you think that you are observing a single locus, but in fact the data from 2 different loci get combined. Locus 1 is 100% allele A and locus 2 is 100% allele B. This would give you high heterozygozities. In fact, when you do have paralogs, removing SNPs where Het is greater than 0.5 or 0.6 may help removing those paralogs.

ADD REPLY
0
Entering edit mode

See... I am now sure I am a complete ignorant because I cannot understand your explanation :(

The link to the variation is here: http://www.ensembl.org/Homo_sapiens/Variation/Explore?r=3:197694045-197695045;source=dbSNP;v=rs112111814;vdb=variation;vf=25173810

if contains 1092 individuals from 1K genome project with genotype calls: 1044 (C|C) / 48 (C|T)

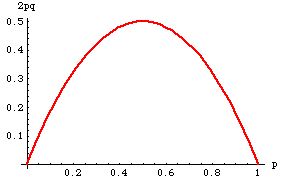
The way I would look at this in the population tested there are 97% homozygotes (C|C) so according to your own graph the AvHet should be below 0.1 or am I just completely misunderstanding the calculations?

Thank you for your patience Eric

PS: this variation is a single locus.

ADD REPLY
5
Entering edit mode
10.8 years ago
confusedious ▴ 470

On this one, just go back to Hardy-Weinberg equilibrium to calculate what you might expect.

p^2 + 2pq + q^2 = 1

So if you have a heterozygosity of almost 0.5 (which is generally the maxiumum heterozygosity that you can have), it would mean that almost half of the individuals in the sample were of course heterozygotes. In this case, you could assume that the allele frequencies of both p and q are close to 0.5. Any other allele frequency would result in less heterozygosity.

Do be careful, however, when you use the word dominant. An allele frequency of 0.8 does not always mean that the allele is dominant. If a population recently underwent a bottleneck for example, there is a chance that a recessive allele could have been pushed to near fixation by drift.

For the sake of having an example, let's begin with a biallelic system where p = 0.8 and q = 0.2. Let's use this to calculate heterozygosity.

1 = 0.8^2 + 2 x 0.8 x 0.2 + 0.2^2 1 = 0.64 + 0.32 + 0.04

So in this case, heterozygosity would be 0.32

So that's the relationship between allele frequencies and heterozygosity out of the way.

It is my understanding that average heterozygosity, as an average, must be taken from across many loci. So if there is an average heterozygosity of 0.25 for example, you could theoretically have quite diverse heterozygosities from locus to locus. As such, you should not impute too much about the allele frequency of a given locus from an average heterozygosity that is taken from across many loci.

Does this help?

ADD COMMENT
2
Entering edit mode

Average heterozygosity can be taken for one locus across many individuals.

ADD REPLY
0
Entering edit mode

Curious: For a biallelic marker, a diploid individual is either a heterozygote or they are not. Therefore, if you were to encode it, it would be binary. Would that then mean you would be taking a mean of a whole pile of ones and zeros? I could see that making some sense. If you are determining what portion of individuals are heterozygotes at a single locus, is this not just traditional heterozygosity? I don't mean to sound in any way cheeky or facetious here, as a newcomer myself I would just like to hear how it is done, and if so why it is useful.

ADD REPLY
1
Entering edit mode

I see what you mean. From Van Dyke, F. 2002. Conservation Biology: Foundations, Concepts, Applications. 2nd ed. Springer. 477 p.: heterozygosity: carrying different alleles for a particular genetic locus, as opposed to homozygous (having the same alleles) or hemizygous (having one allele). Average heterozygosity is a measure of genetic diversity at the population scale and indicates the average proportion of individuals that are heterozygous for a given trait.

ADD REPLY
0
Entering edit mode

Thank you for that Eric. It is good to clarify what is meant by this - I suppose one must assume that a sample one takes represents something like an average of the entire population, as sampling the whole population is usually impossible.

ADD REPLY
1
Entering edit mode

In this case I believe the avHet value reported in dbSNP is calculated for that locus across many samples. so I believe the allele frequency should be directly related with the avHet according to the graph given by @Eric Normandeau

ADD REPLY
0
Entering edit mode

Oh I see. Multiple samples meaning multiple groups of individuals (populations perhaps)?

ADD REPLY
3
Entering edit mode
10.8 years ago

If p is the frequency of allele A and q = 1 - p is the frequency of allele B, then the chance of having an heterozygous individual in a population with random mating is equal to 2pq. The relationship between p and AvHet is thus the following:

enter image description here

ADD COMMENT
0
Entering edit mode

Thanks... the visuals do help :)

ADD REPLY
0
Entering edit mode

Still do not understand why I am getting the variations with a much more dominant allelic member when filtering using avHet>0.4 and AvHetSE >= 0.1. Following your chart, those parameters would give me an allelic frequency interval for allele A (on a biallelic variation) between 0.25 and 0.75. However many variations outside these limits are still passing the filtering limits. :S

ADD REPLY
0
Entering edit mode
5.8 years ago
Shicheng Guo ★ 9.4k

Average heterozygosity from all observations. Note: may be computed on small number of samples.Standard Error for the average heterozygosity. Average heterozygosity should not exceed 0.5 for bi-allelic single-base substitutions. https://www.ncbi.nlm.nih.gov/SNP/Hetfreq.html

ADD COMMENT

Login before adding your answer.

Traffic: 2682 users visited in the last hour
Help About
FAQ
Access RSS
API
Stats

Use of this site constitutes acceptance of our User Agreement and Privacy Policy.

Powered by the version 2.3.6