I have the population structure results of three datasets obtained using STRUCTURE software and the structure software has determined three sub-populations for dataset one, six for dataset two and nine for dataset three. Datasets one, two and three contain around 289, 368, and 467 samples each. All the samples present in dataset one are present in dataset three however some of the samples in dataset two are present in dataset three whereas others are not present. For example, sample A13 is classified as sub-population1 in Dataset one and three but not present in Dataset two so specified as NA.
Some of the samples which were not assigned to any specific sub-population were categorized as admixture. For example, sample A9 is classified as sub-population1 in Dataset one and three but categorize as admixture in Dataset two so specified as admix.
It is also possible that accession assigned to different sub-populations in different datasets. For example, sample A12 is classified as sub-population3 in Dataset one, admix in dataset two and sub-population 1 in dataset three.
Samples Dataset1    Dataset2    Dataset3
A1  NA  NA  1
A2  NA  Admix   1
A3  NA  NA  1
A4  NA  NA  1
A5  NA  NA  1
A6  NA  NA  1
A7  NA  5   1
A8  NA  6   1
A9  1   Admix   1
A10 1   Admix   1
A11 2   1   1
A12 3   Admix   1
A13 1   NA  1
A14 1   NA  1
A15 2   5   1
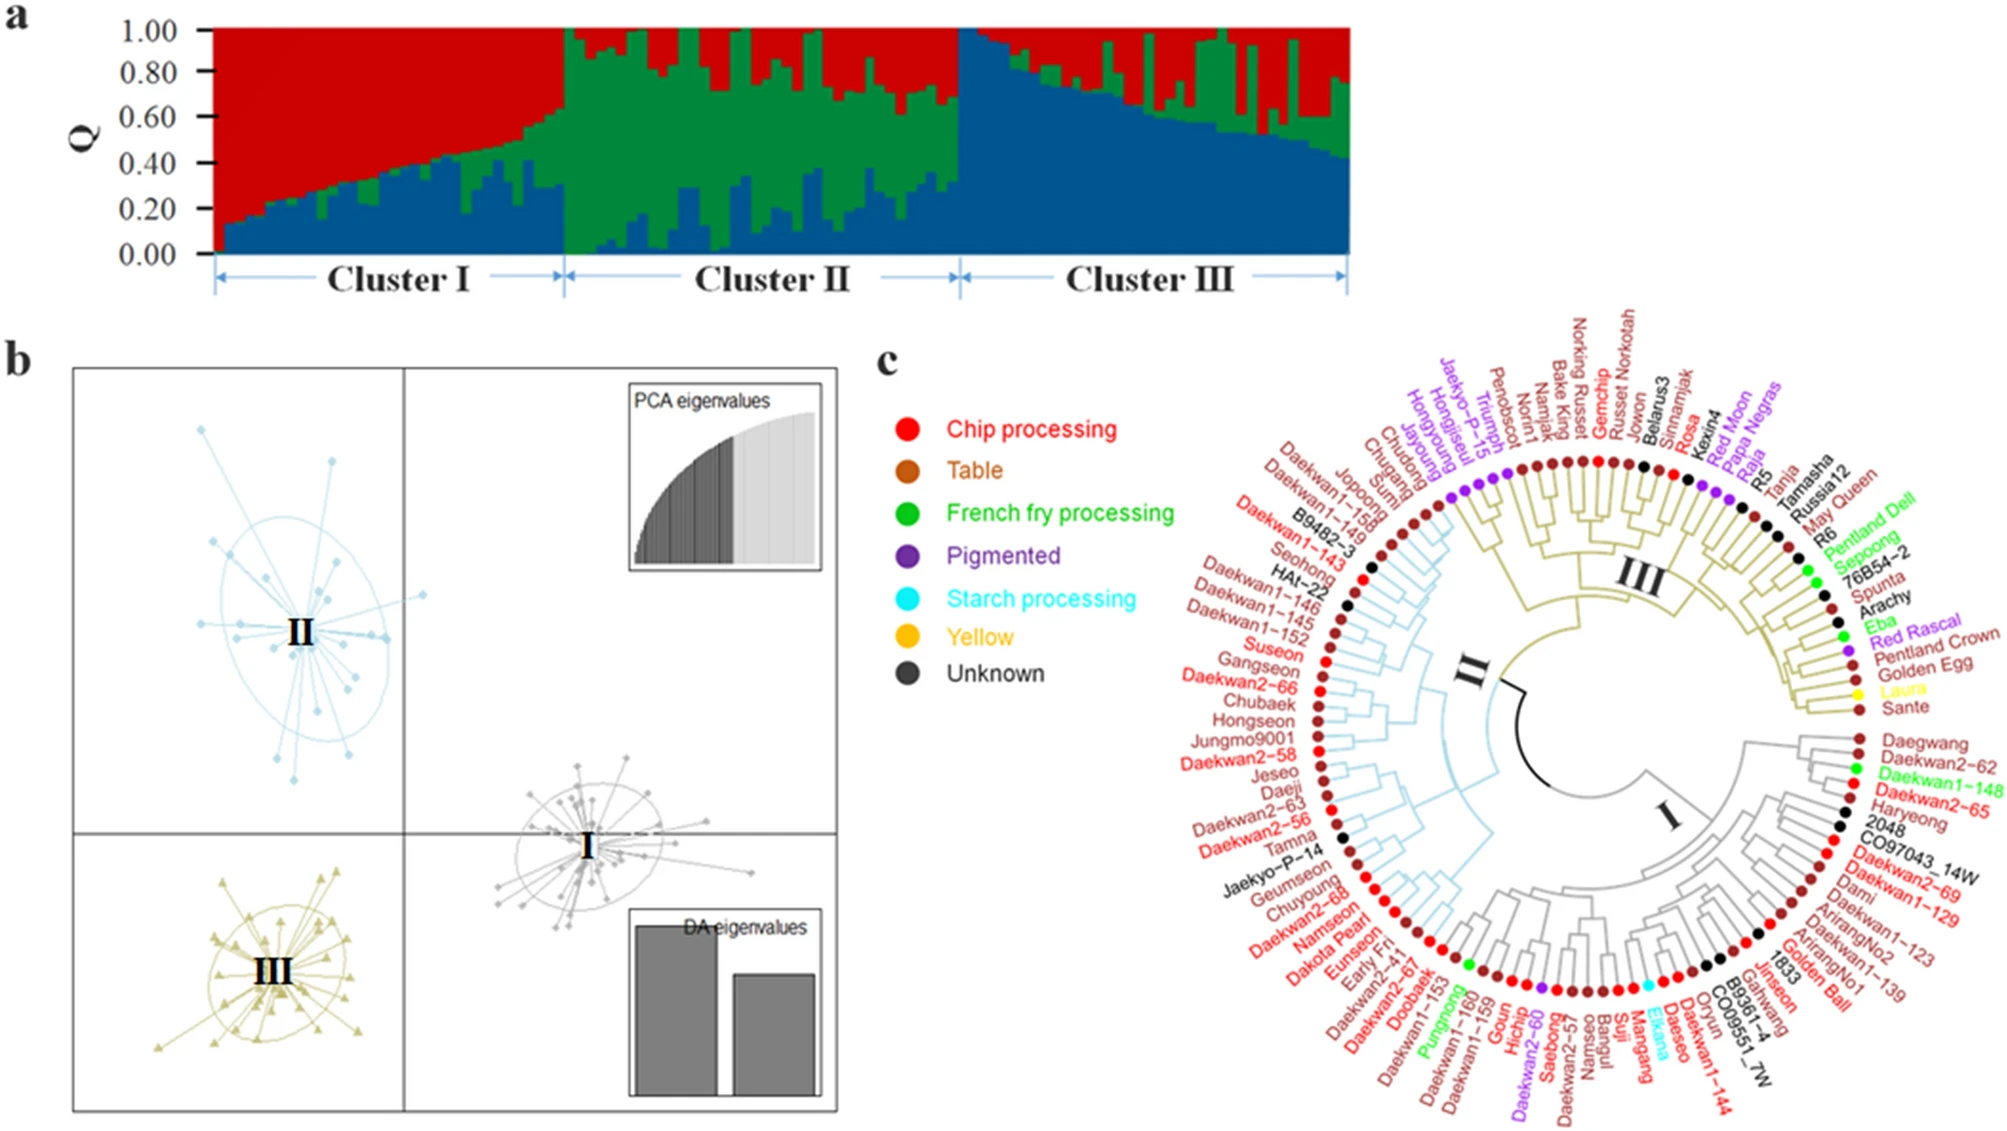
Now I am interested to generate a circular dendrogram to compare the population structure results to generate something like Figure 1c  where we can try to compare three different sub-populations, with dendogram colours corresponding to nine clusters/sub-populations based on dataset 3, nodes colors corresponds to six sub-populations of dataset two and leaf colors corresponds to three sub-populations of dataset one. The missing values (NA) can be colored as black.
I have tried Dendextend and circlizepackage but didn't get much success, Any help will be highly appreciated


R package ggtree maybe useful: https://github.com/YuLab-SMU/ggtree